llm-thermometer
Report
What will technology look like in 2050?
- Id:
20250303T144808 - Language Model:
unsloth/Mistral-Small-24B-Instruct-2501-bnb-4bit - Embedding Model:
jina-embeddings-v3


Statistical Summary
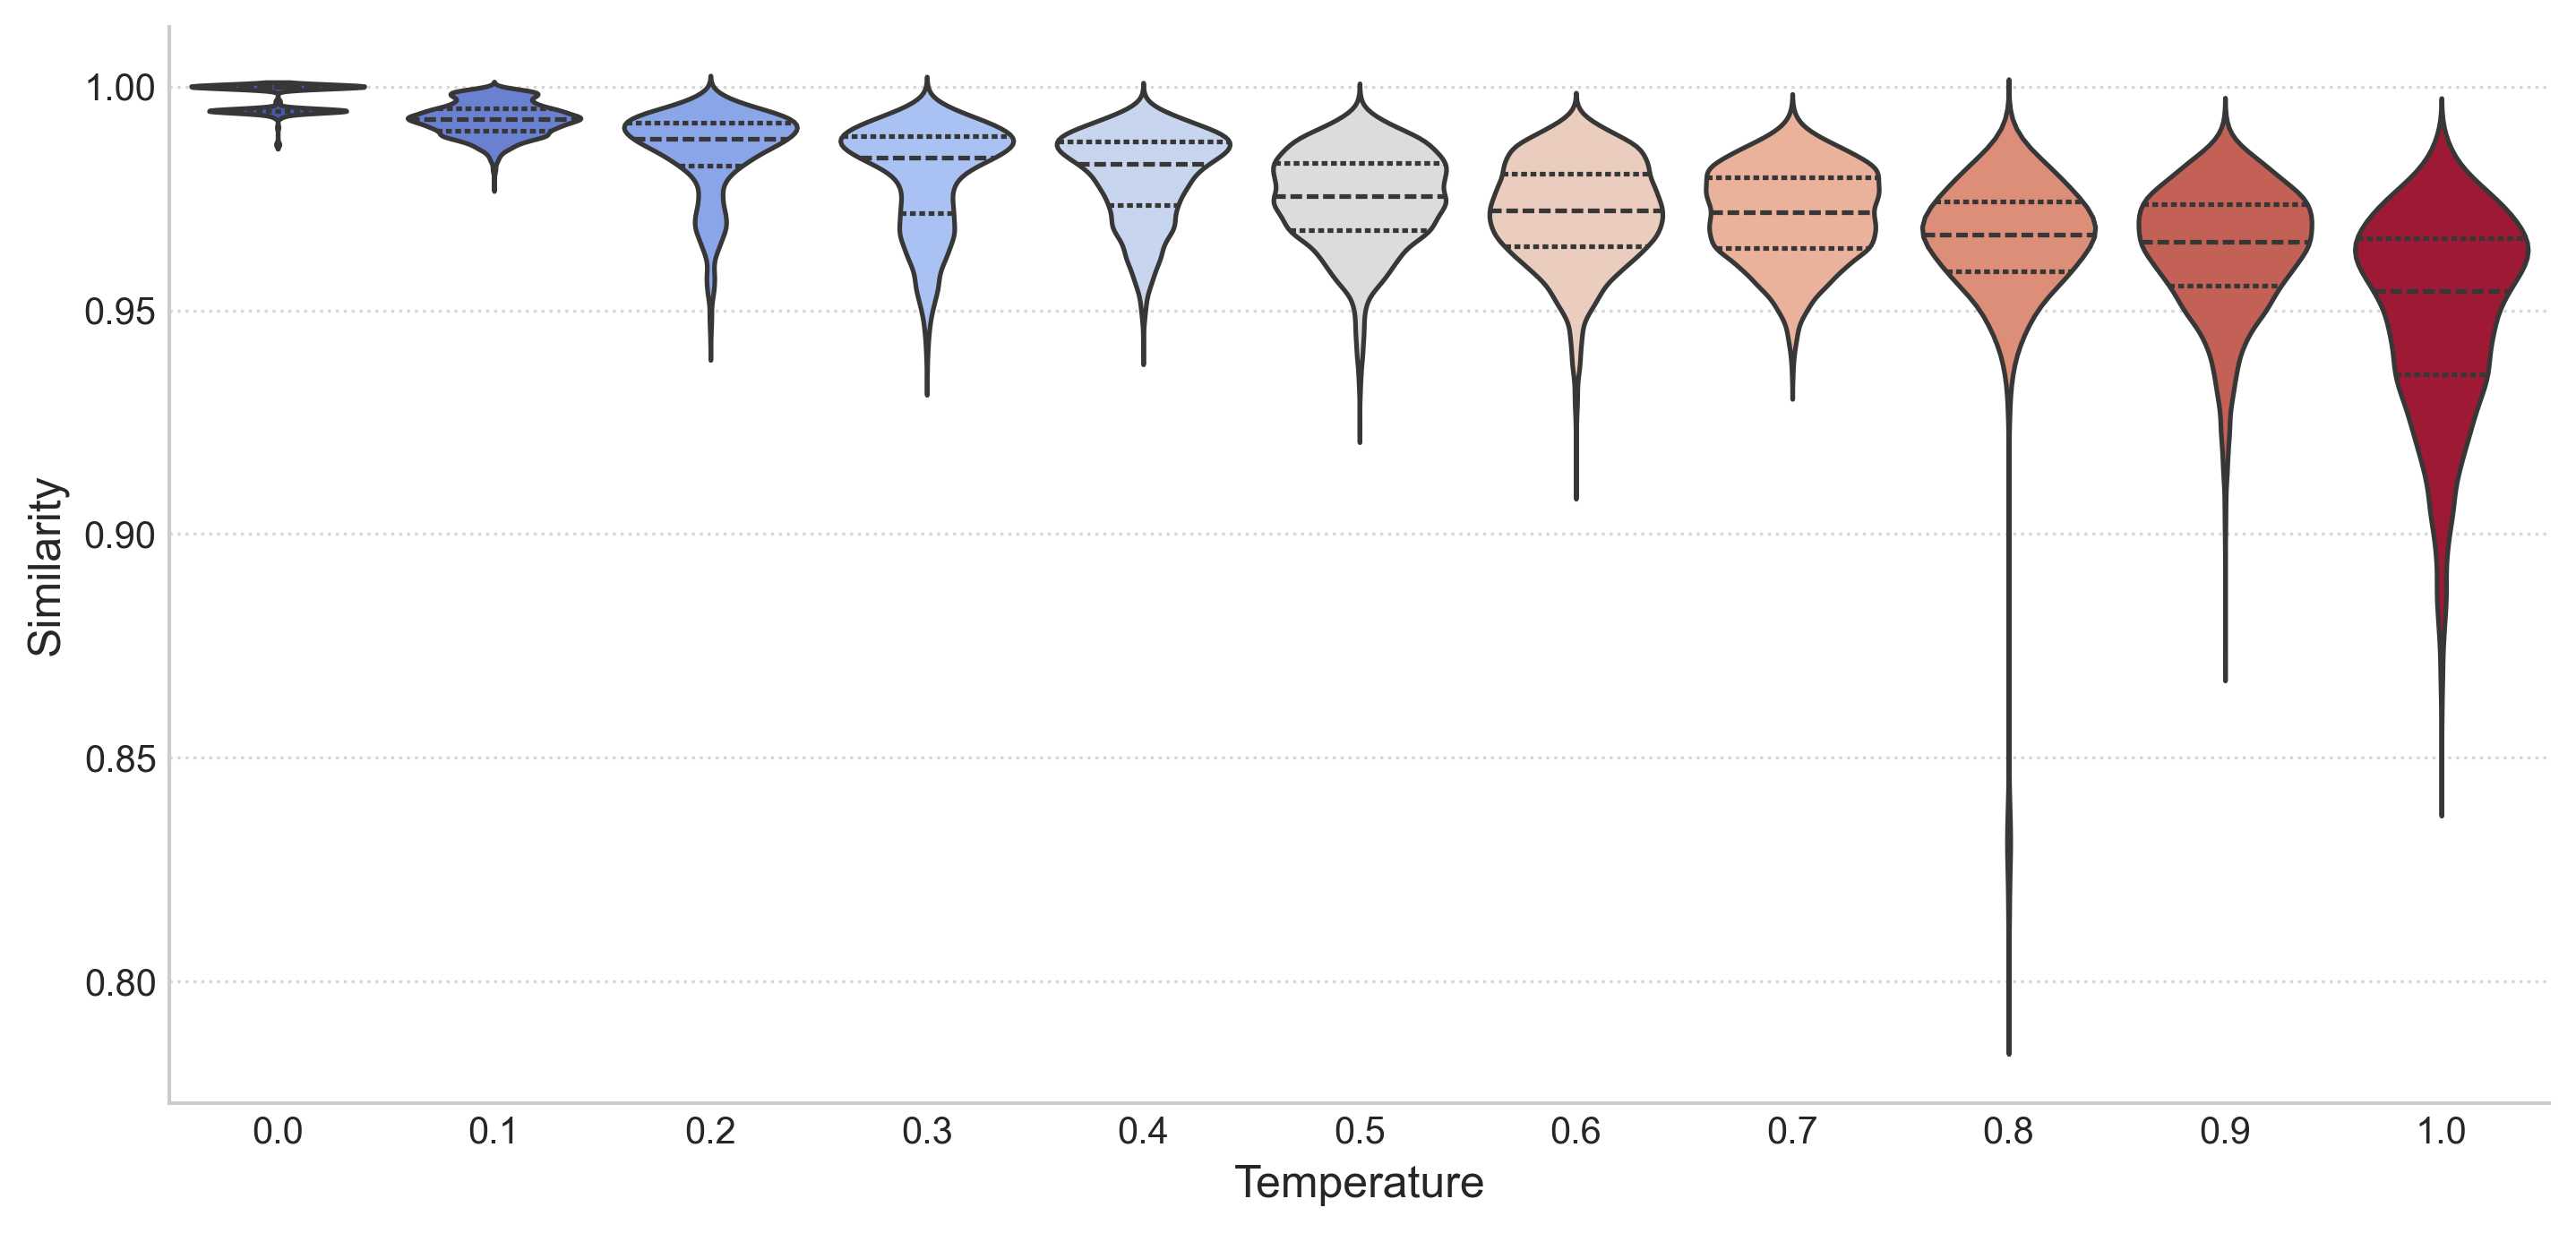
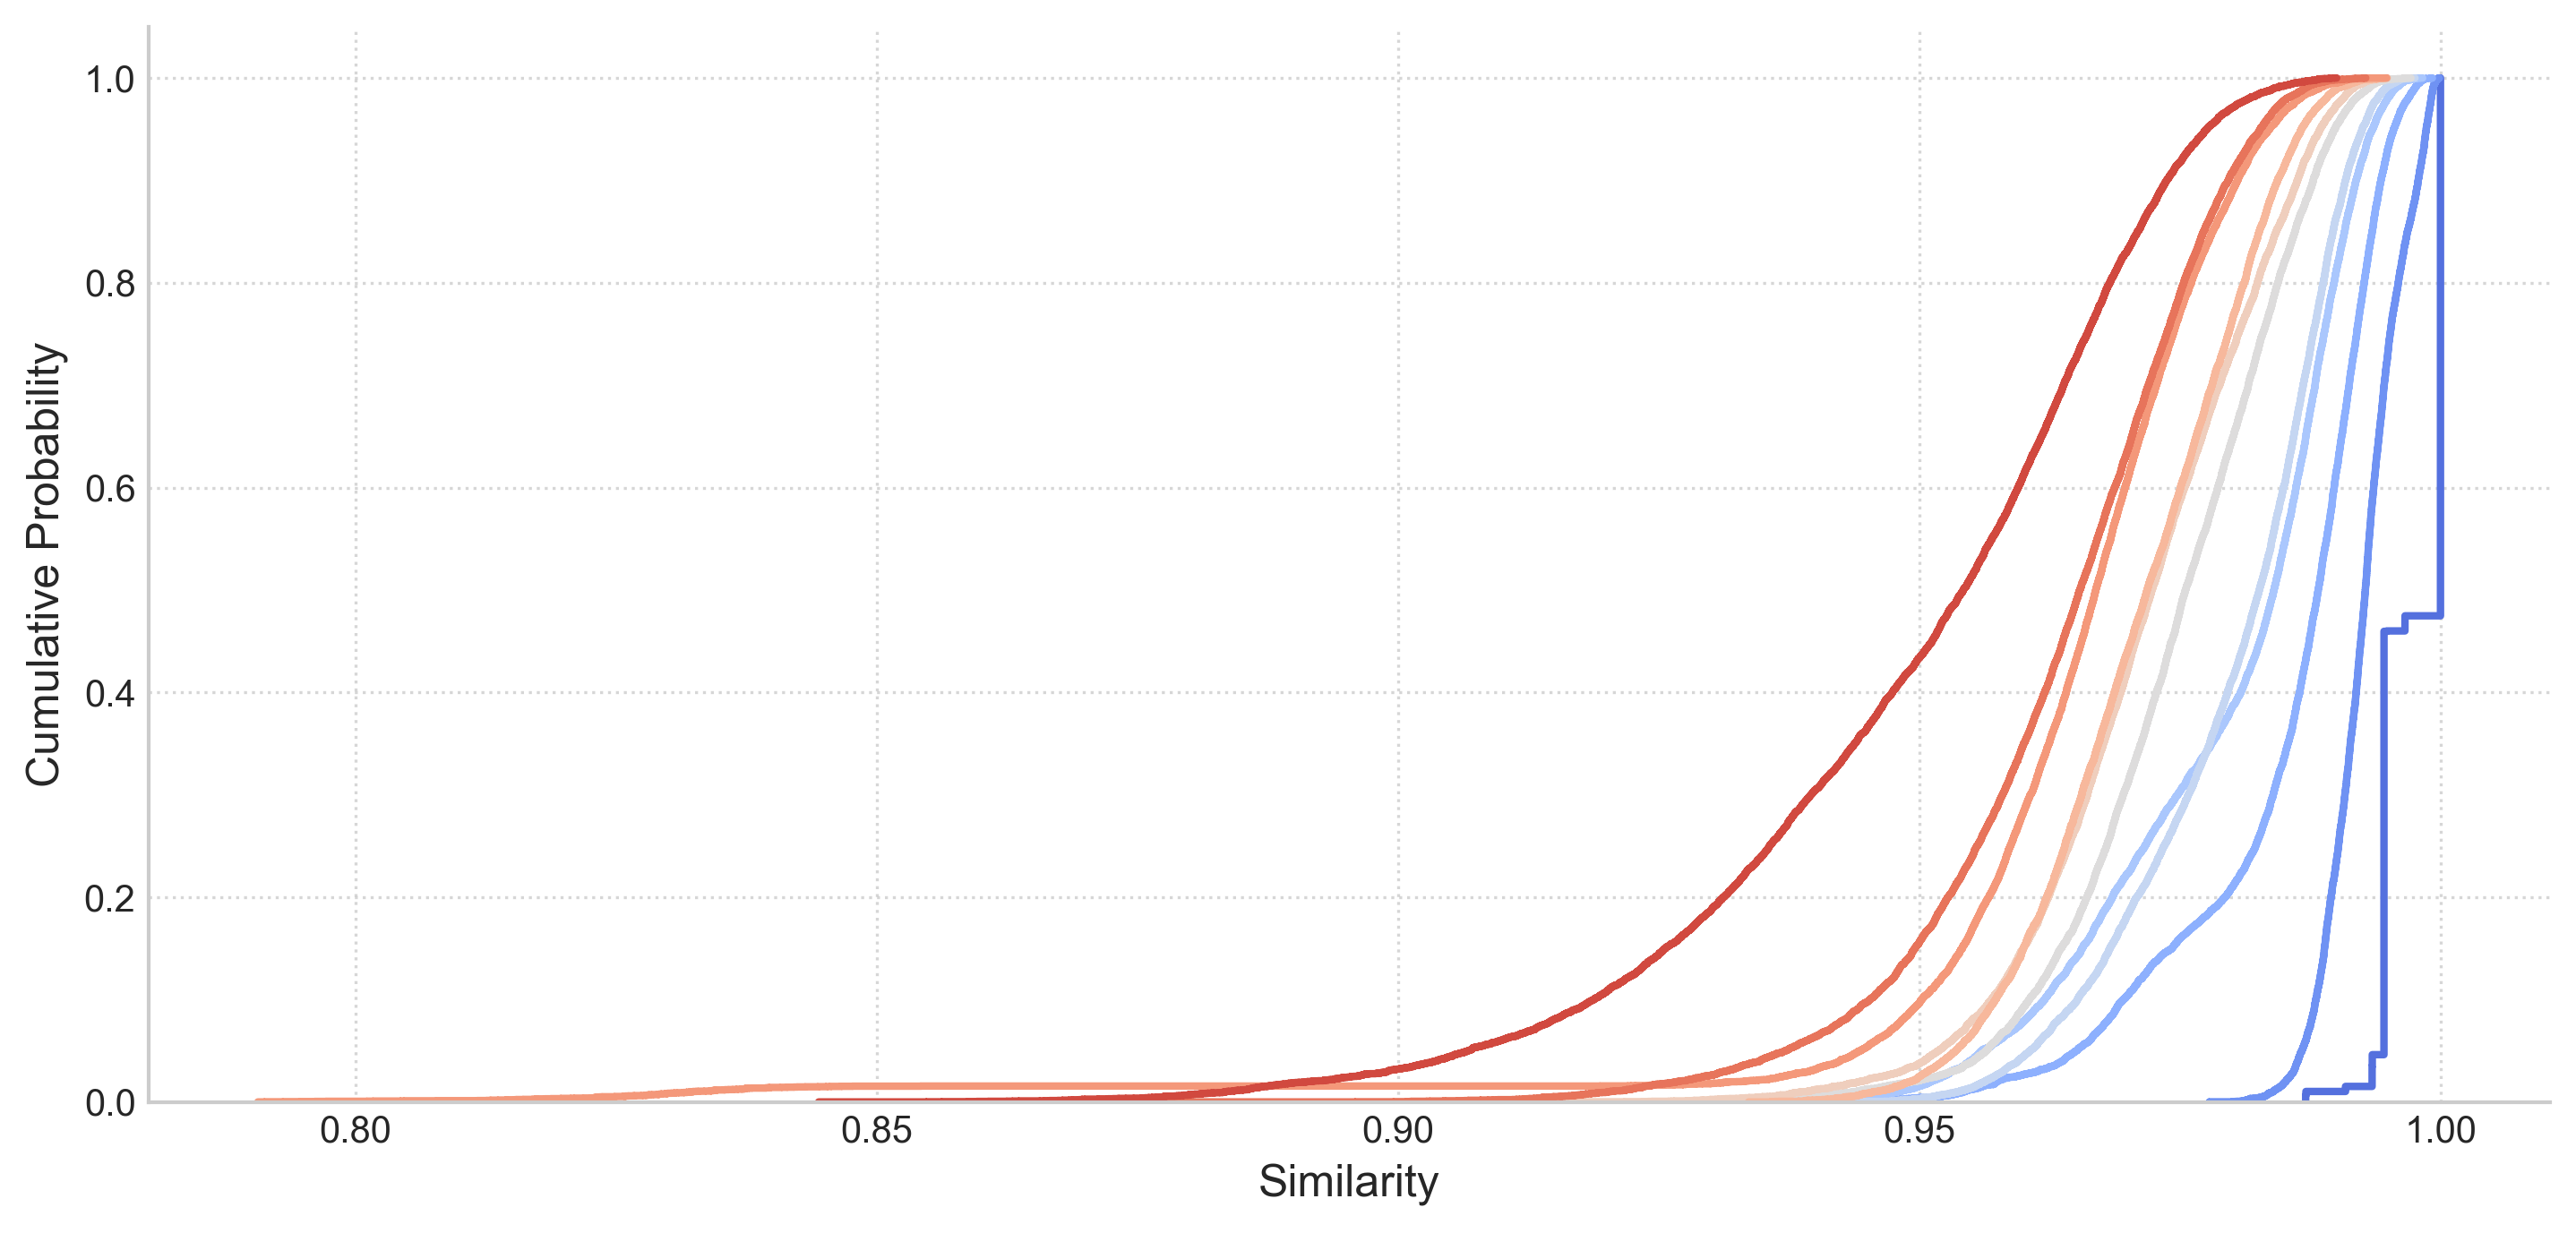
| temperature | Mean | Median | Std Dev | Min | 25% | 75% | Max | Count |
|---|---|---|---|---|---|---|---|---|
| 0 | 0.9973 | 1 | 0.0029 | 0.9871 | 0.9946 | 1 | 1 | 8128 |
| 0.1 | 0.9927 | 0.9928 | 0.0036 | 0.9778 | 0.9902 | 0.9952 | 0.9999 | 8128 |
| 0.2 | 0.9853 | 0.9883 | 0.0097 | 0.9421 | 0.9823 | 0.992 | 0.9992 | 8128 |
| 0.3 | 0.9798 | 0.984 | 0.0119 | 0.935 | 0.9717 | 0.9888 | 0.9983 | 8128 |
| 0.4 | 0.98 | 0.9826 | 0.01 | 0.9412 | 0.9735 | 0.9878 | 0.9976 | 8128 |
| 0.5 | 0.9747 | 0.9755 | 0.0107 | 0.924 | 0.968 | 0.9829 | 0.9972 | 8128 |
| 0.6 | 0.9717 | 0.9723 | 0.0116 | 0.9117 | 0.9643 | 0.9806 | 0.9948 | 8128 |
| 0.7 | 0.9713 | 0.9719 | 0.0104 | 0.9336 | 0.964 | 0.9796 | 0.9949 | 8128 |
| 0.8 | 0.9643 | 0.9669 | 0.0206 | 0.7906 | 0.9587 | 0.9744 | 0.9948 | 8128 |
| 0.9 | 0.9635 | 0.9654 | 0.0141 | 0.8719 | 0.9555 | 0.9737 | 0.9928 | 8128 |
| 1 | 0.9493 | 0.9542 | 0.0223 | 0.8444 | 0.9357 | 0.9661 | 0.99 | 8128 |
Generated by LLM Thermometer v0.5.2