llm-thermometer
Report
What will technology look like in 2050?
- Id:
20250303T193518 - Language Model:
unsloth/Mistral-Small-24B-Instruct-2501-bnb-4bit - Embedding Model:
jinaai/jina-embeddings-v2-base-en
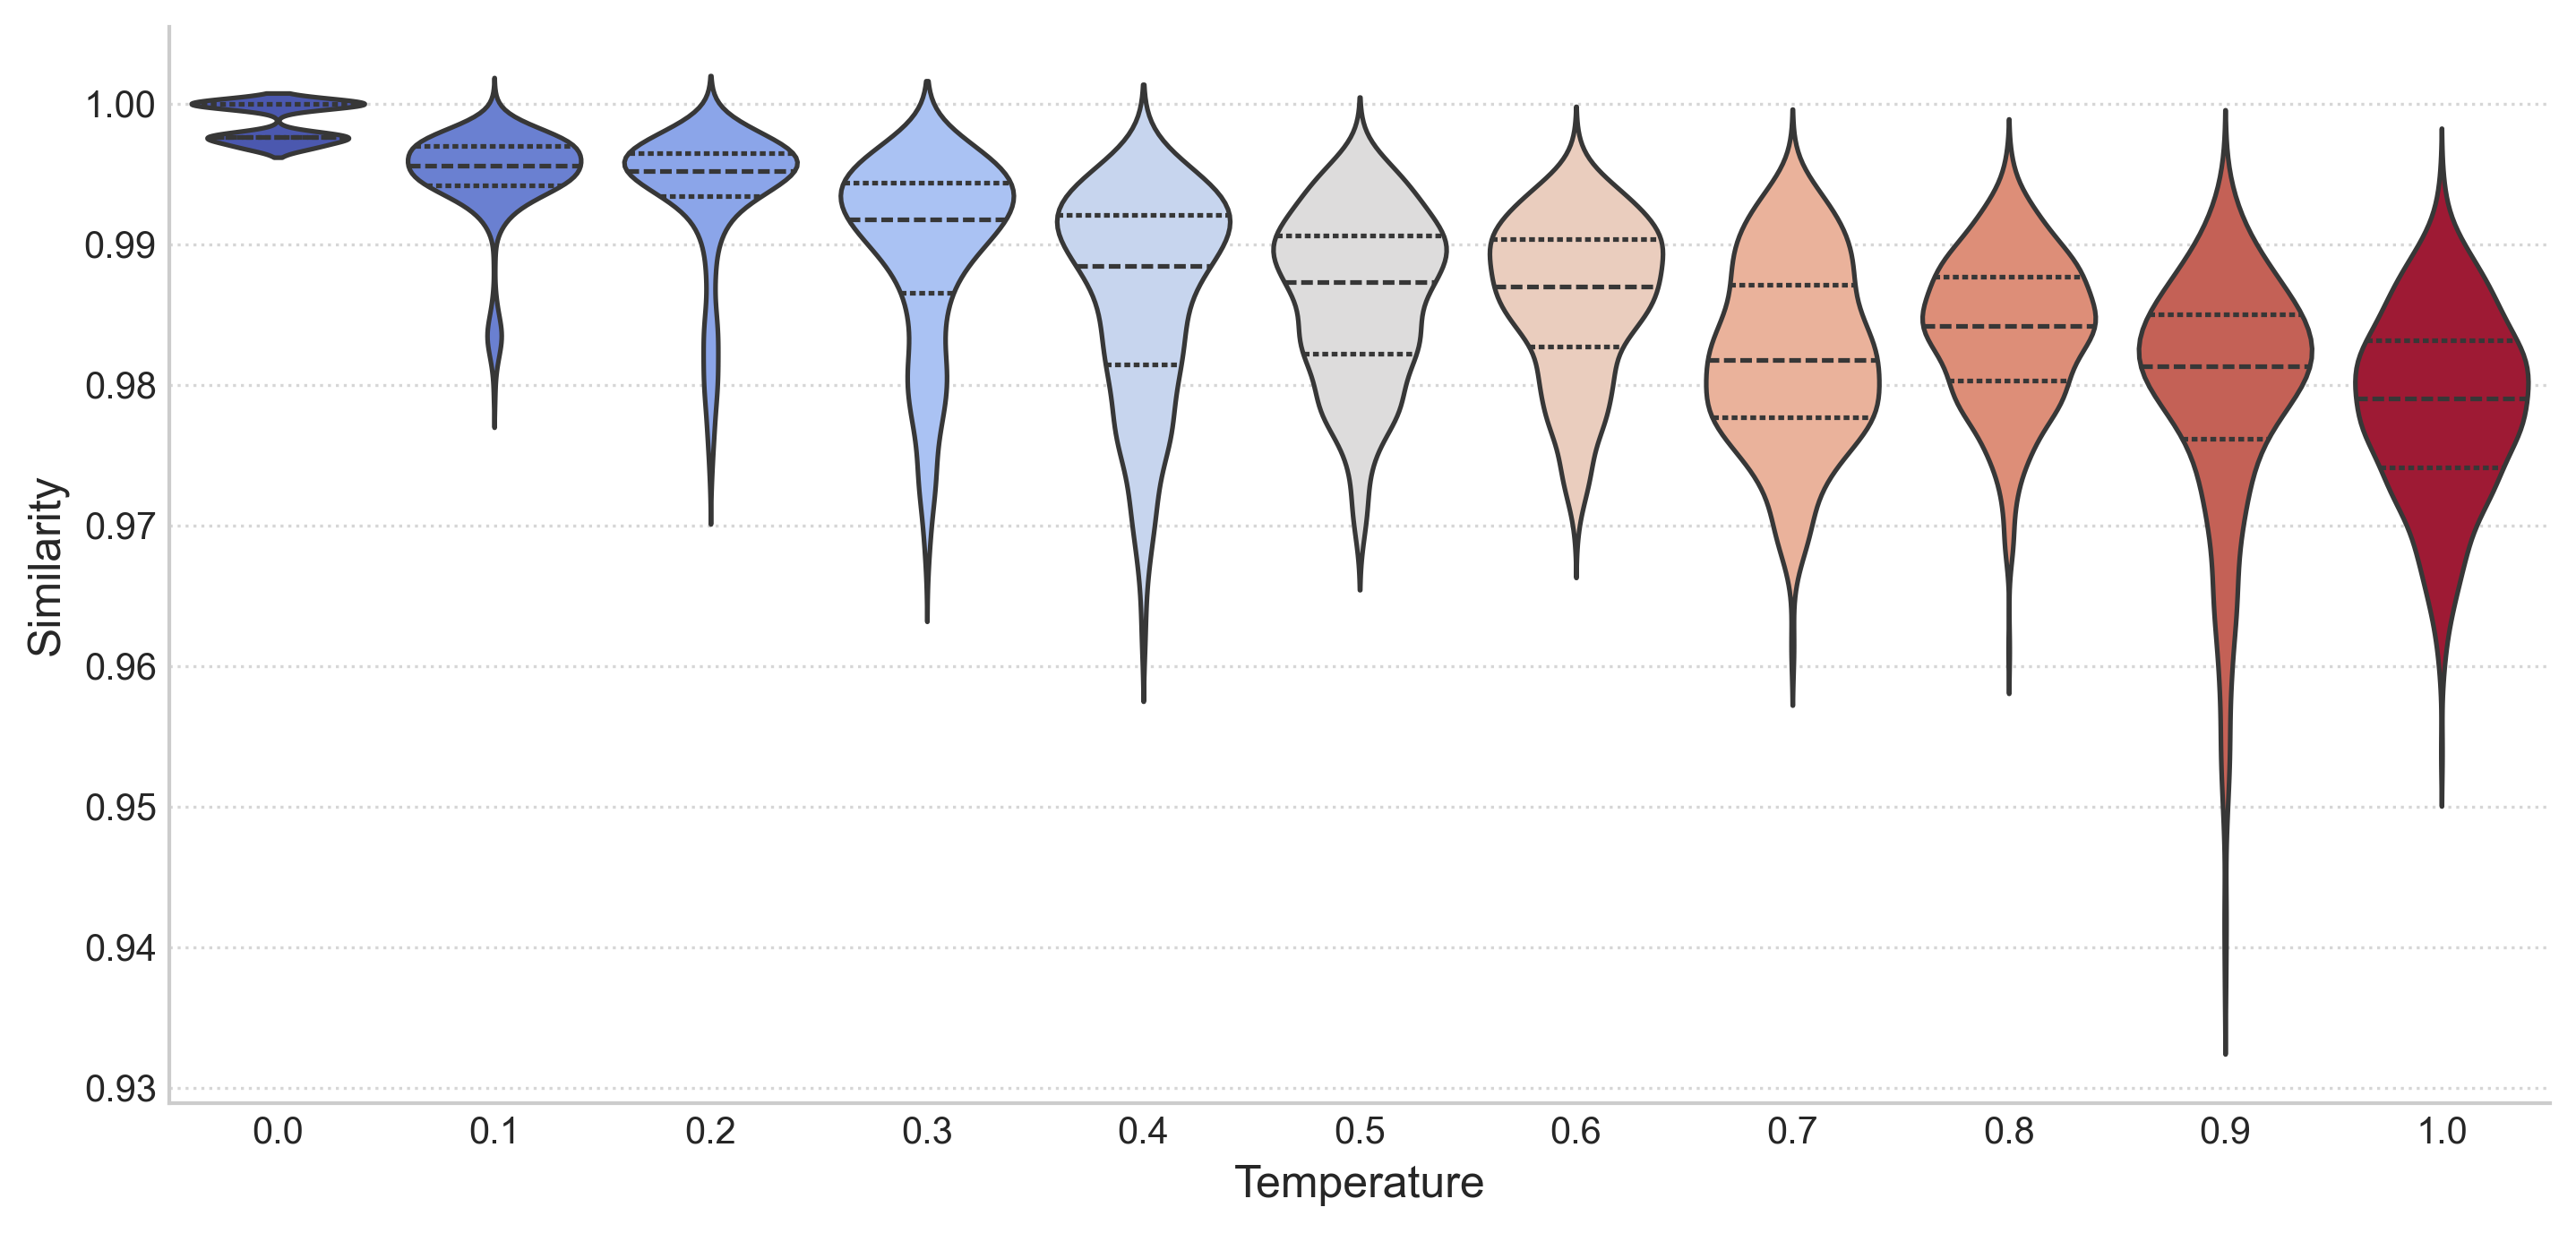
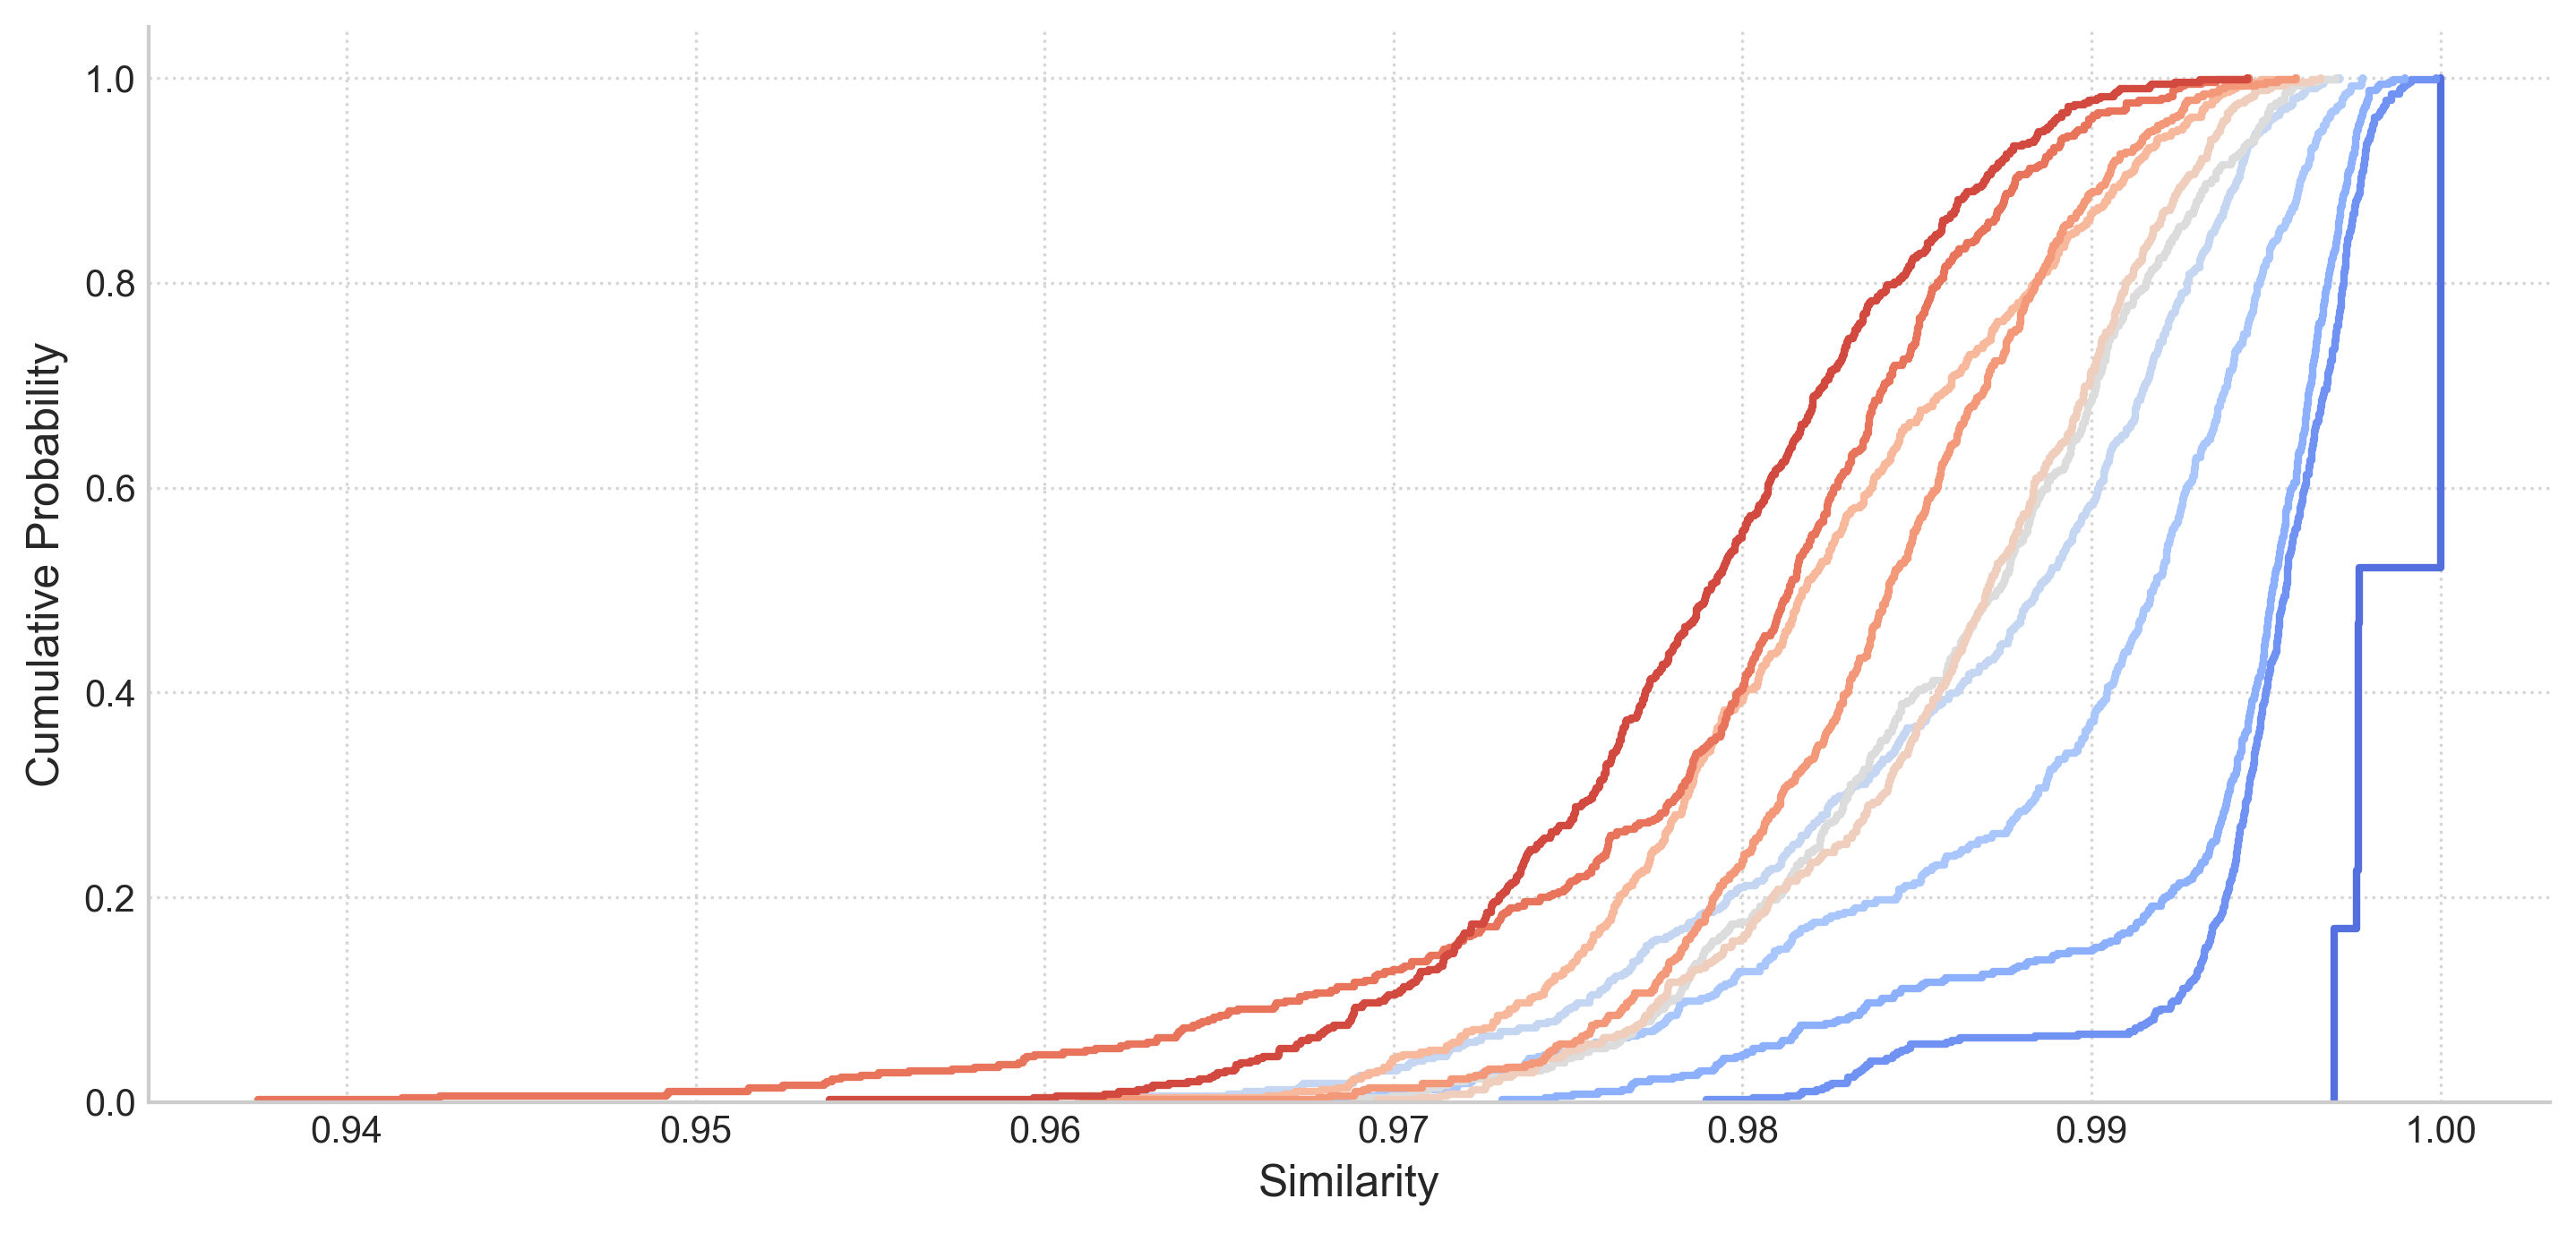
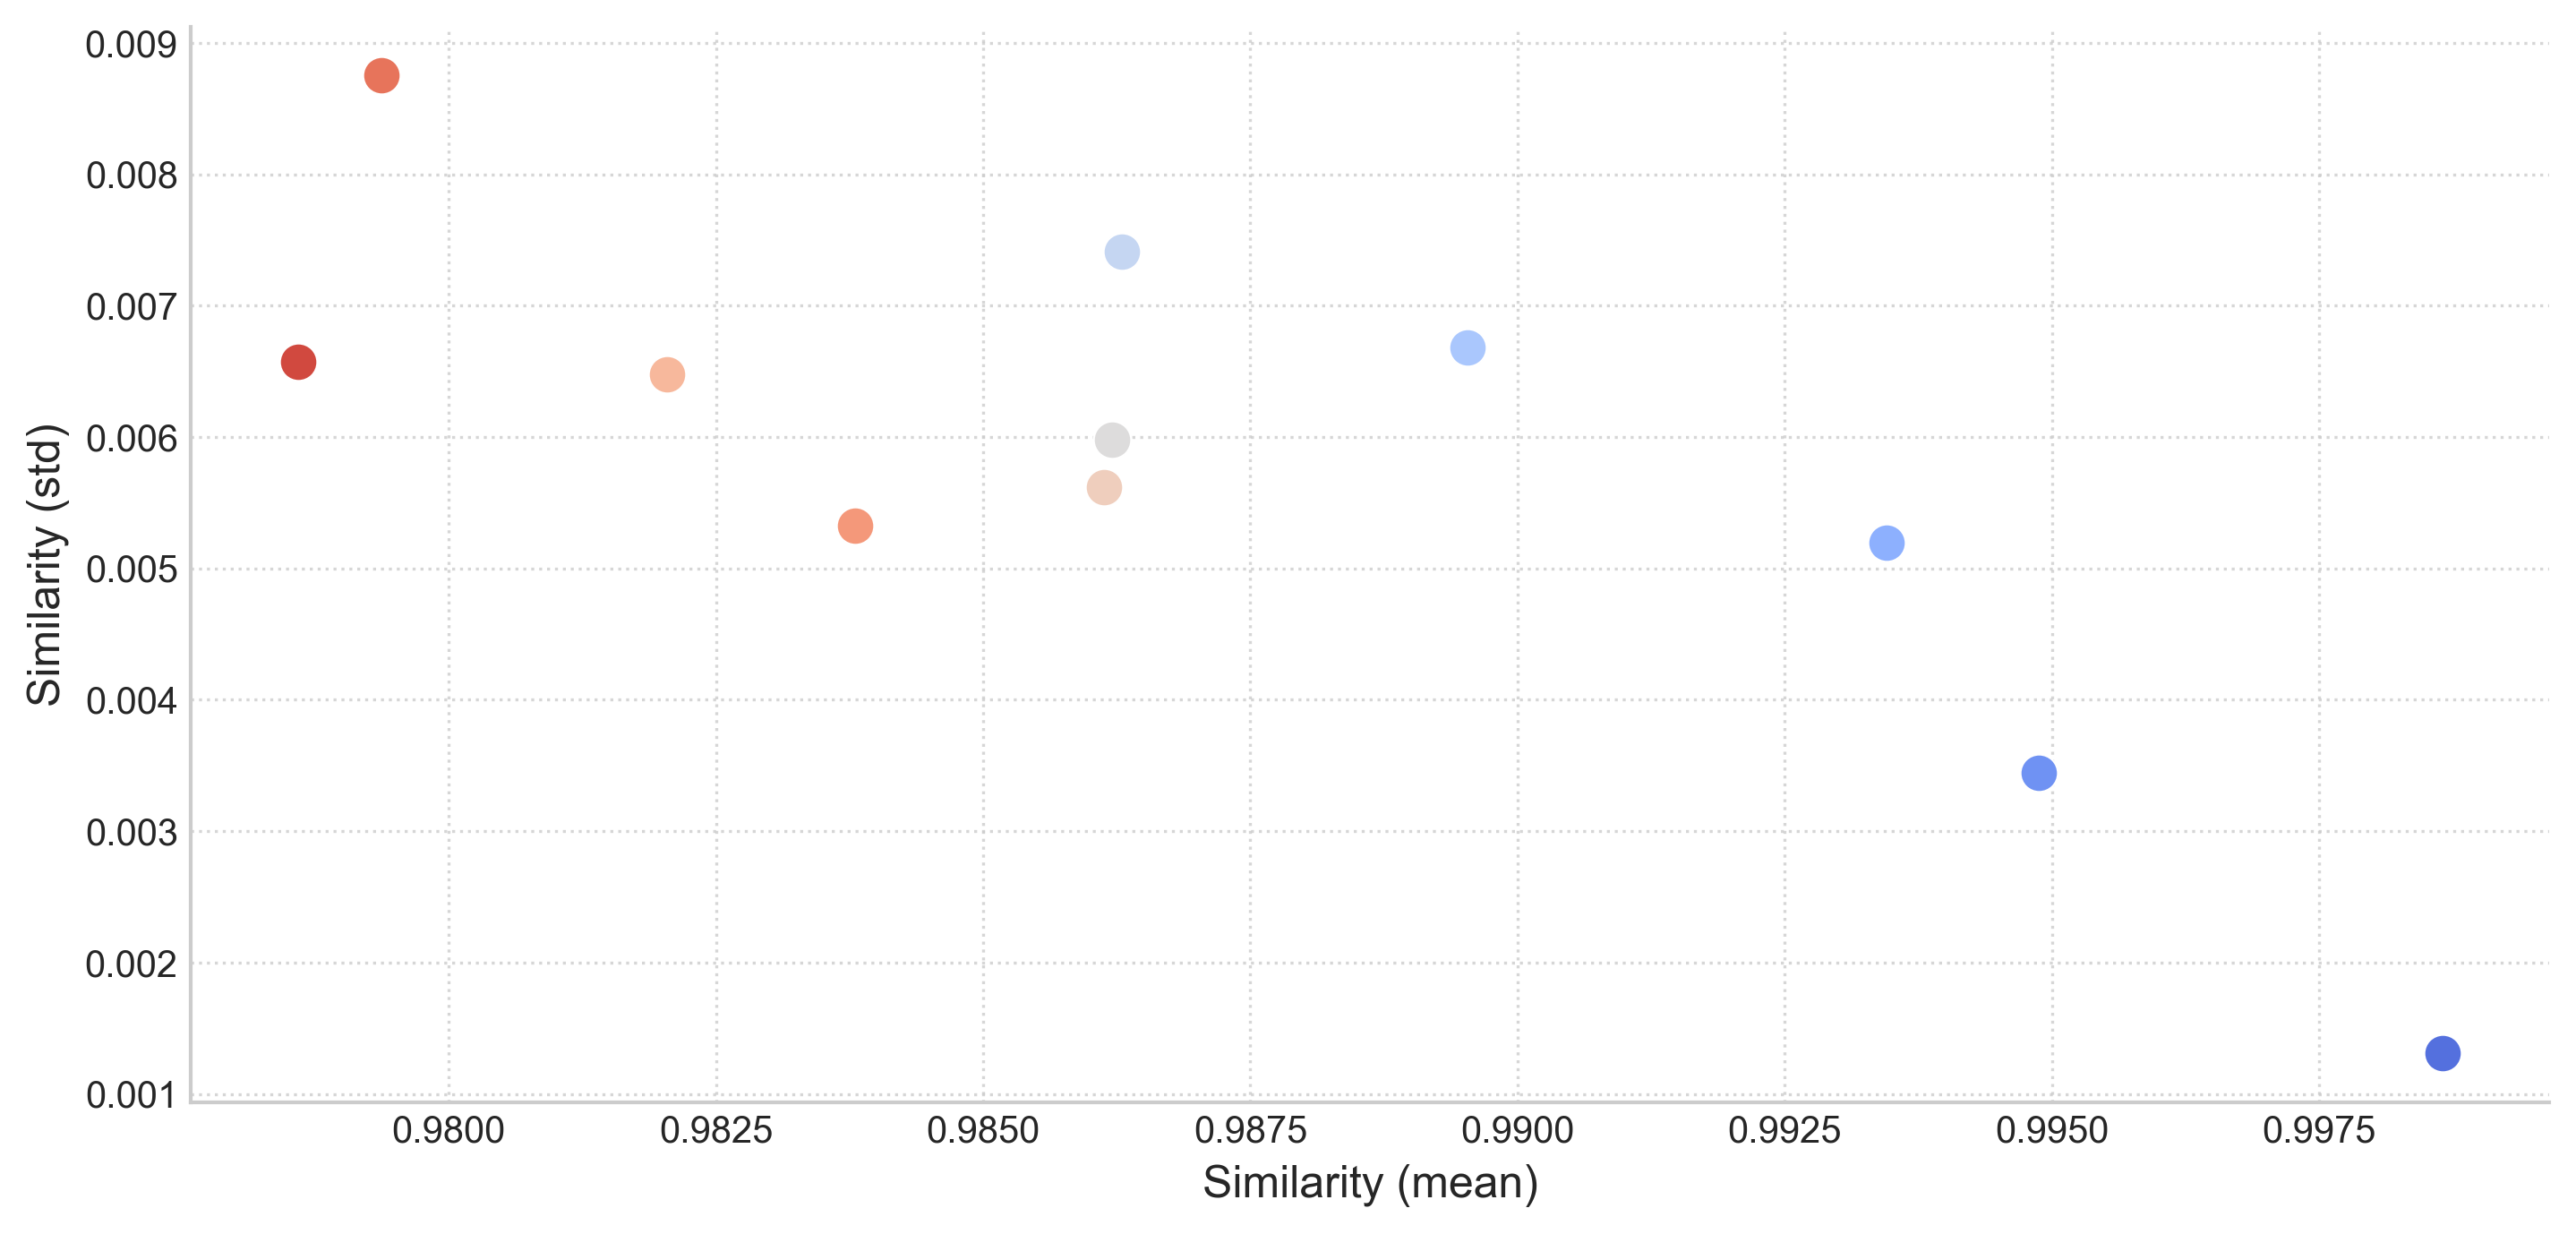
Statistical Summary
| temperature | Mean | Median | Std Dev | Min | 25% | 75% | Max | Count |
|---|---|---|---|---|---|---|---|---|
| 0 | 0.9987 | 0.9977 | 0.0013 | 0.9969 | 0.9977 | 1 | 1 | 496 |
| 0.1 | 0.9949 | 0.9956 | 0.0034 | 0.979 | 0.9942 | 0.997 | 0.9999 | 496 |
| 0.2 | 0.9935 | 0.9952 | 0.0052 | 0.9731 | 0.9934 | 0.9965 | 0.999 | 496 |
| 0.3 | 0.9895 | 0.9918 | 0.0067 | 0.967 | 0.9865 | 0.9944 | 0.9978 | 496 |
| 0.4 | 0.9863 | 0.9885 | 0.0074 | 0.9618 | 0.9814 | 0.9921 | 0.9971 | 496 |
| 0.5 | 0.9862 | 0.9873 | 0.006 | 0.9689 | 0.9822 | 0.9906 | 0.997 | 496 |
| 0.6 | 0.9861 | 0.987 | 0.0056 | 0.9695 | 0.9827 | 0.9904 | 0.9966 | 496 |
| 0.7 | 0.982 | 0.9818 | 0.0065 | 0.961 | 0.9777 | 0.9871 | 0.9959 | 496 |
| 0.8 | 0.9838 | 0.9842 | 0.0053 | 0.9611 | 0.9803 | 0.9877 | 0.9958 | 496 |
| 0.9 | 0.9794 | 0.9813 | 0.0088 | 0.9375 | 0.9761 | 0.985 | 0.9945 | 496 |
| 1 | 0.9786 | 0.979 | 0.0066 | 0.9538 | 0.9741 | 0.9832 | 0.9945 | 496 |
Generated by LLM Thermometer v0.5.2