llm-thermometer
Report
What will technology look like in 2050?
- Id:
20250303T204220 - Language Model:
unsloth/Mistral-Small-24B-Instruct-2501-bnb-4bit - Embedding Model:
jinaai/jina-embeddings-v2-base-en
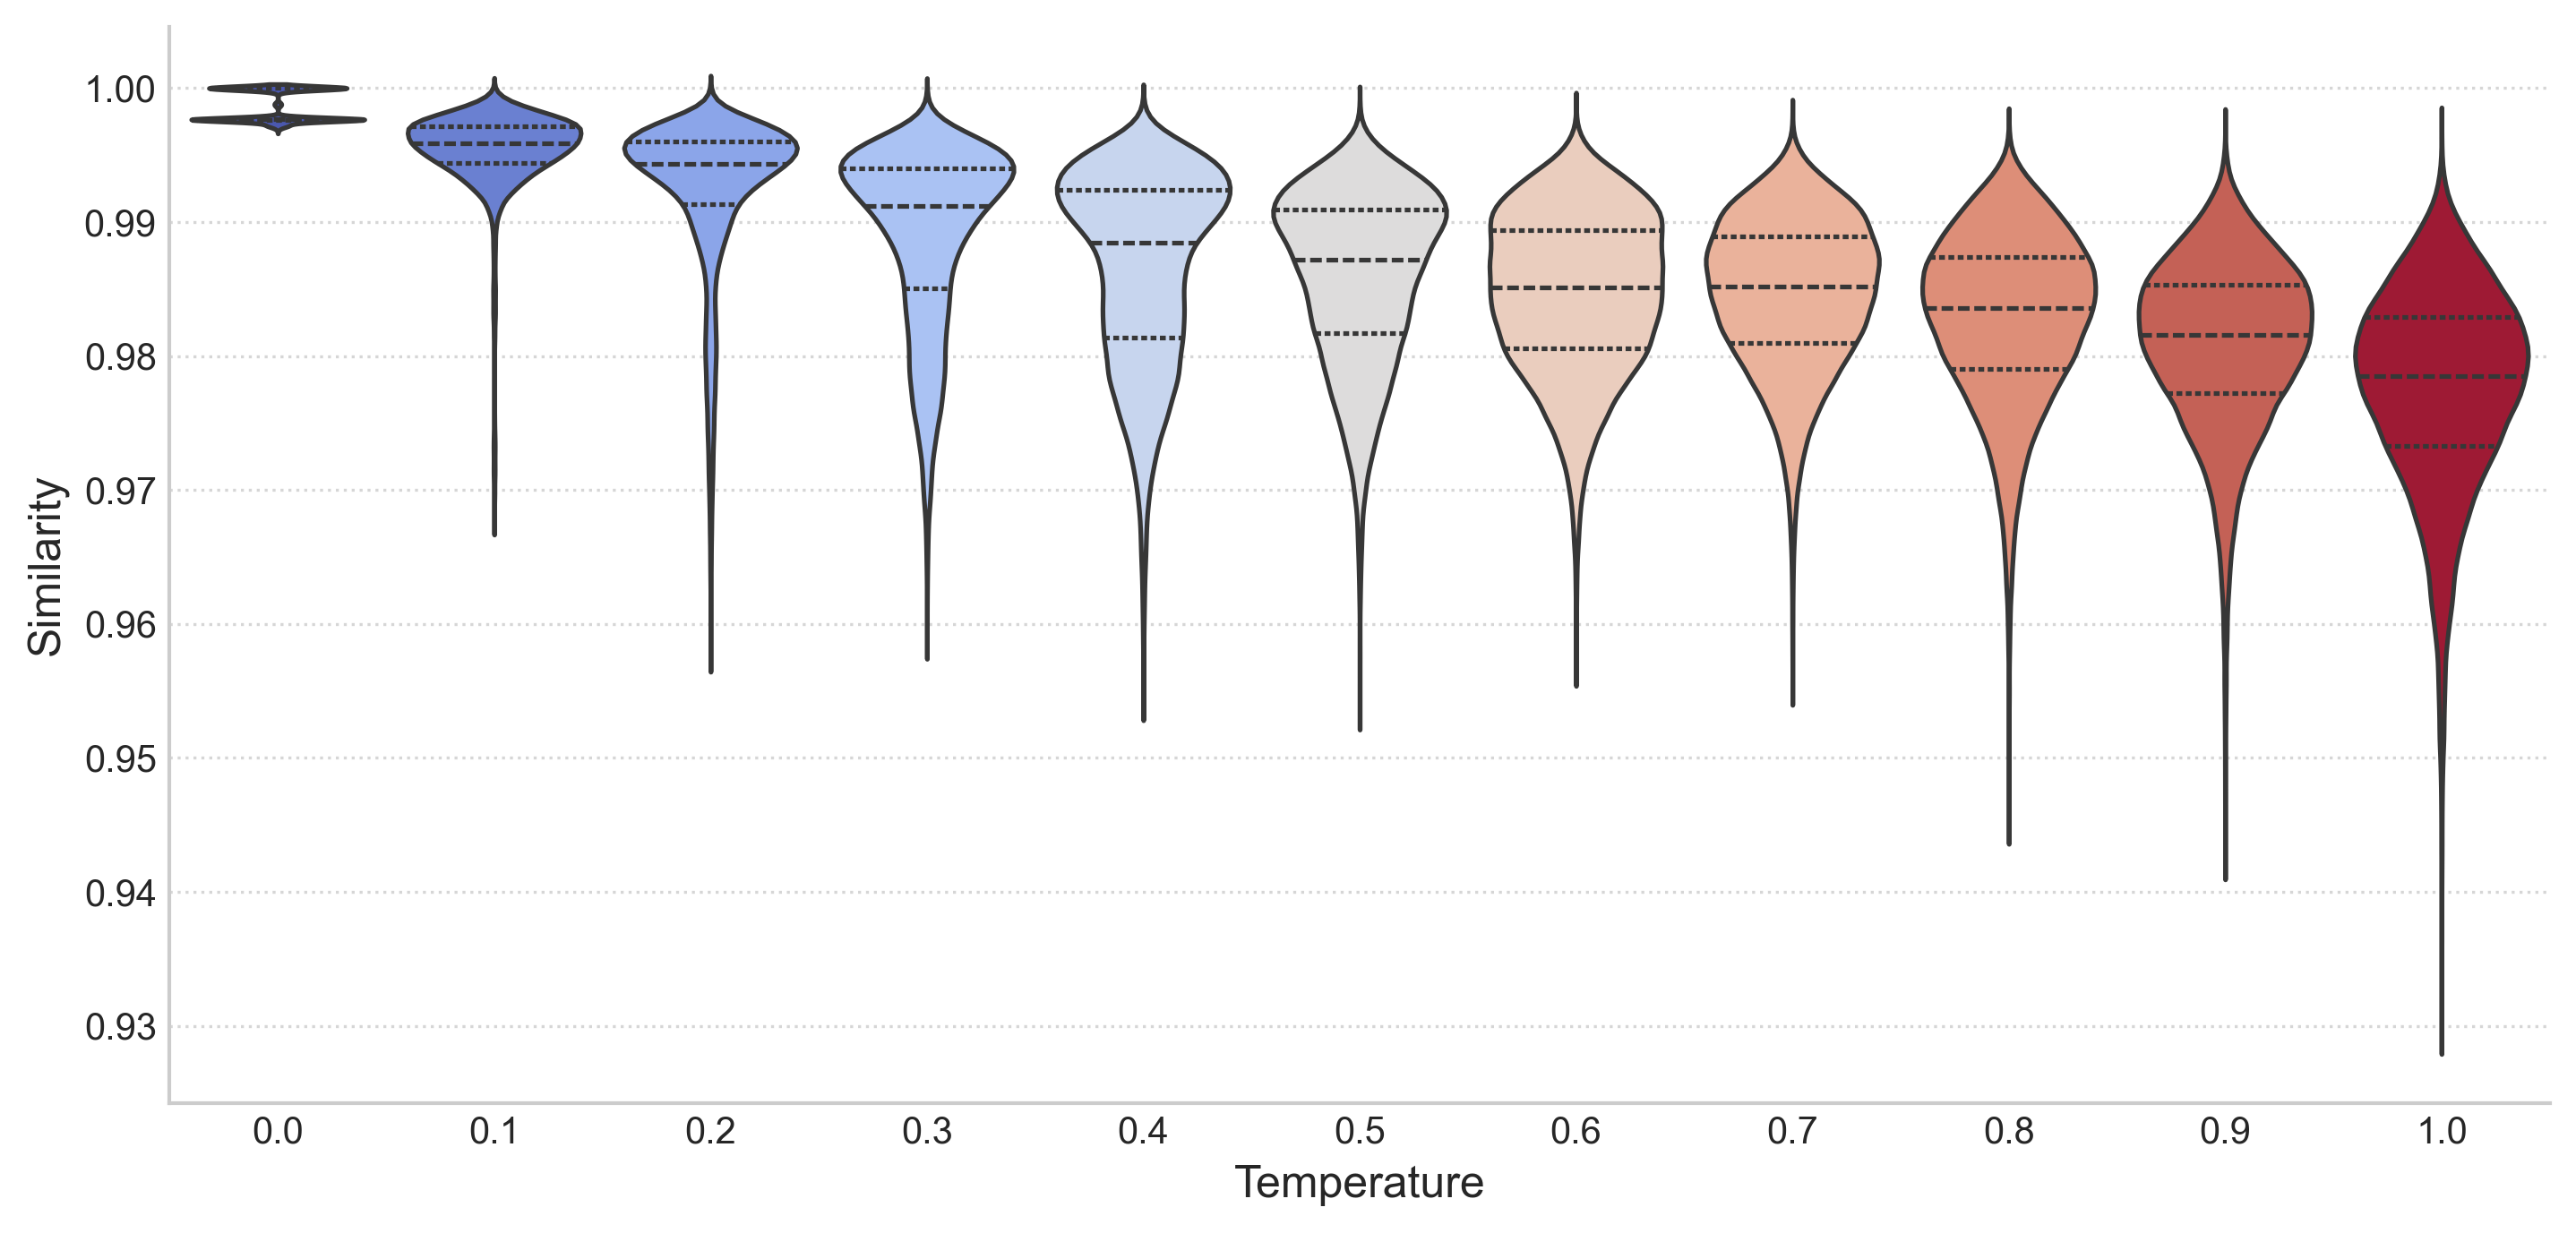
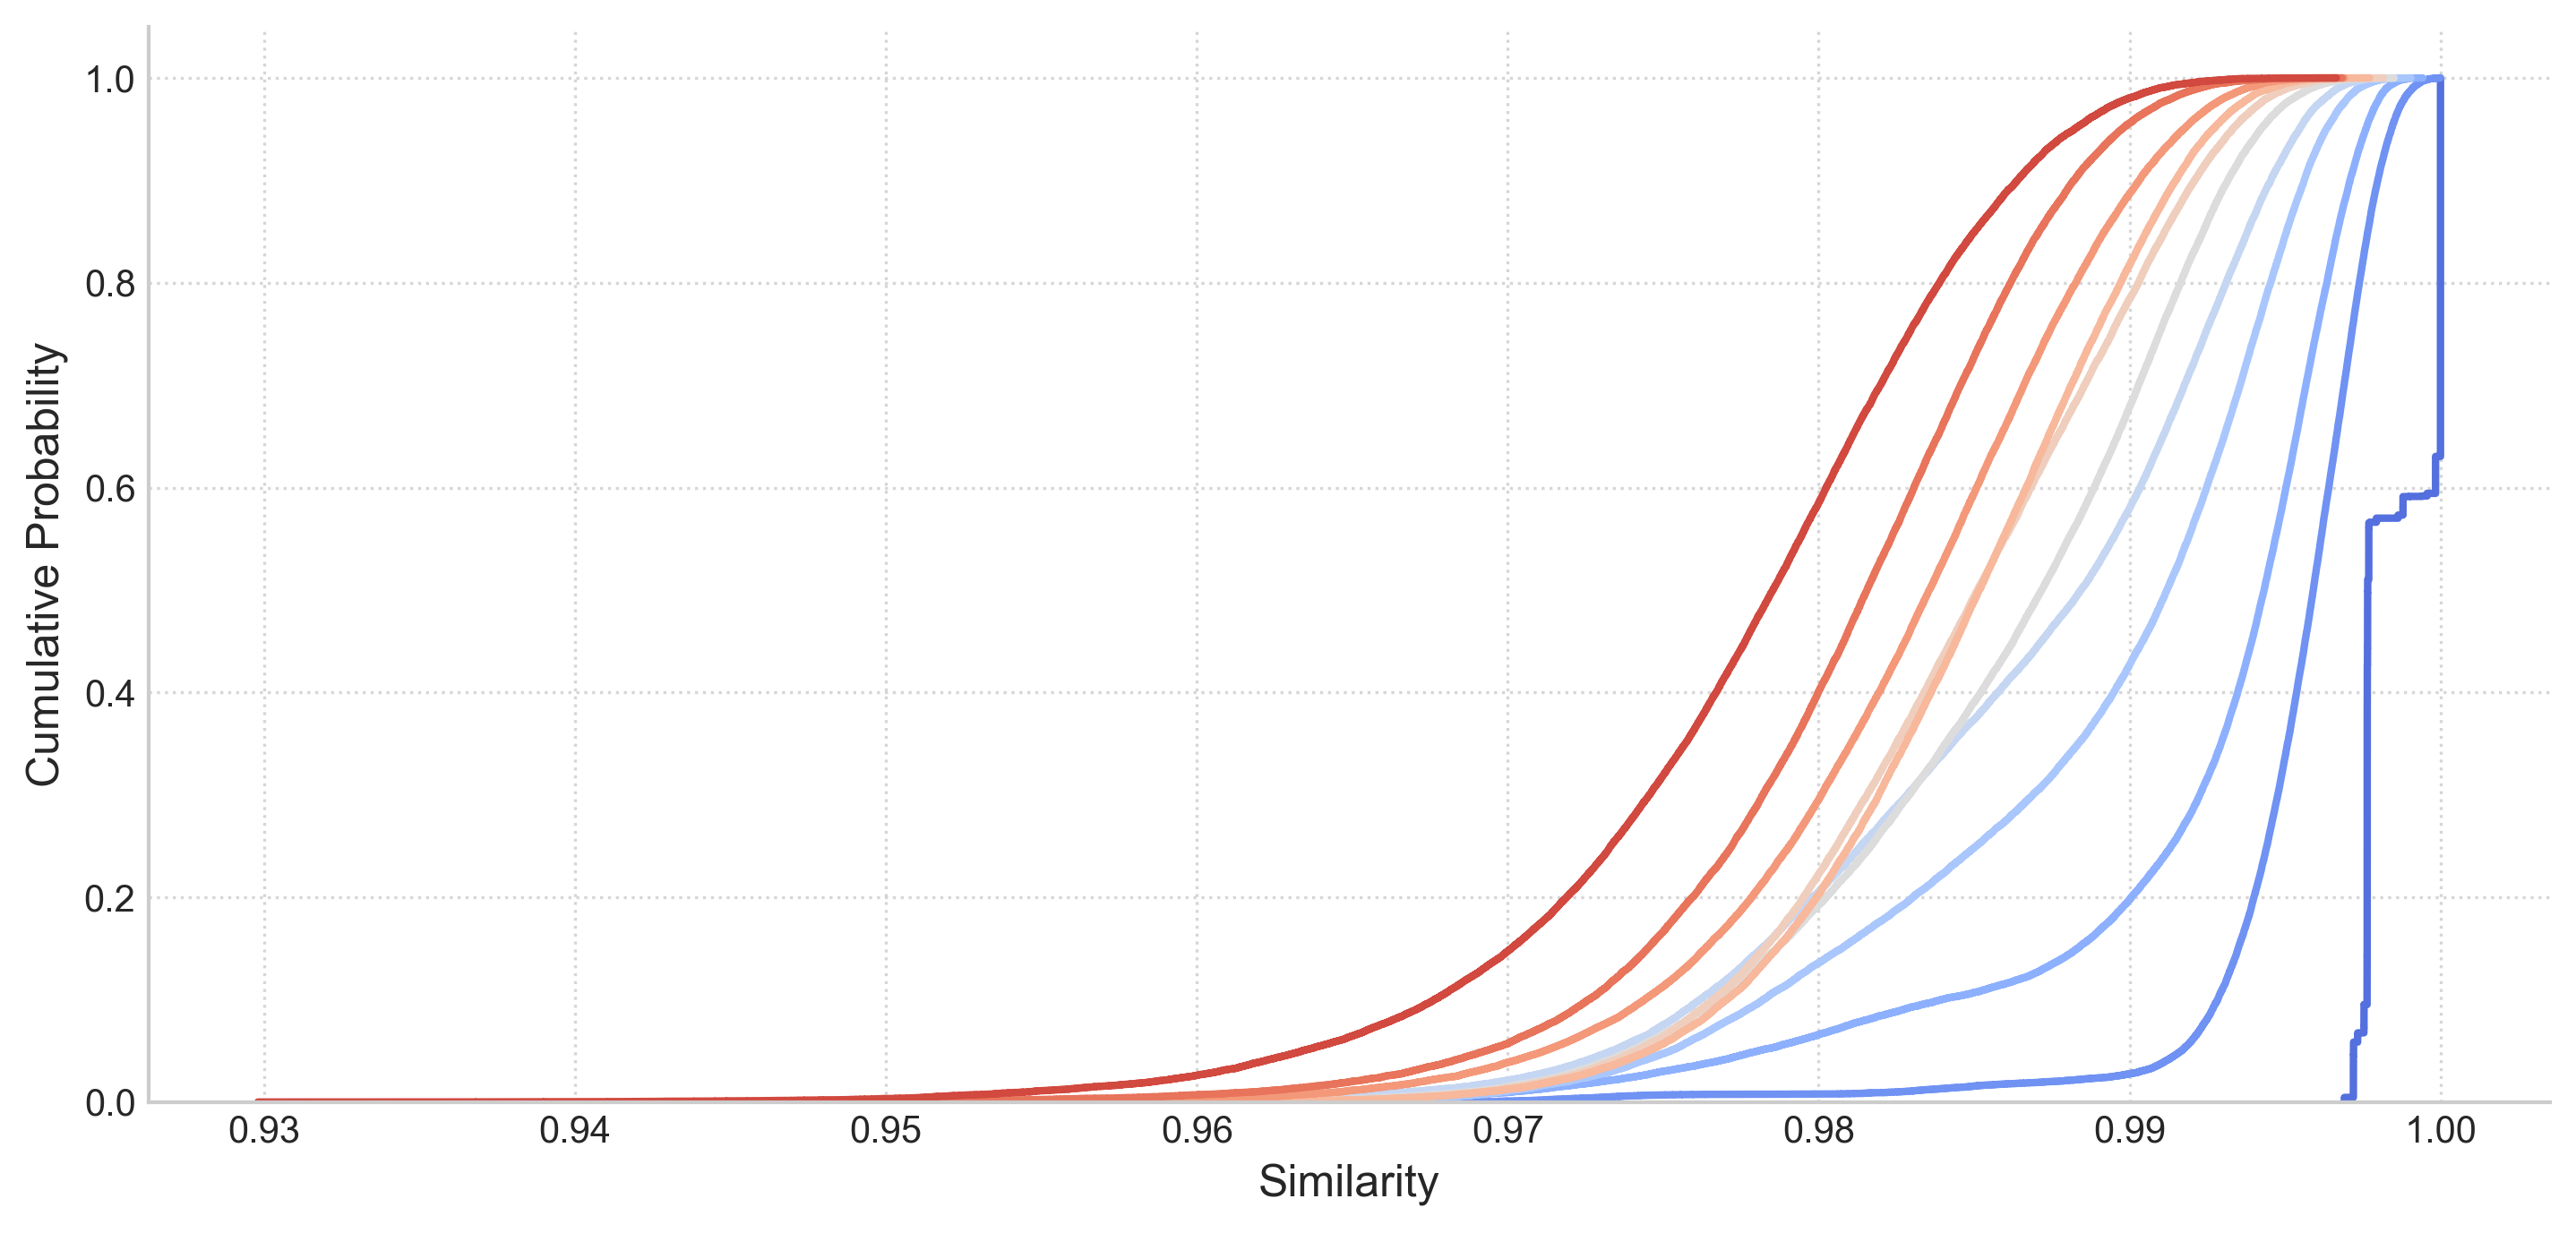
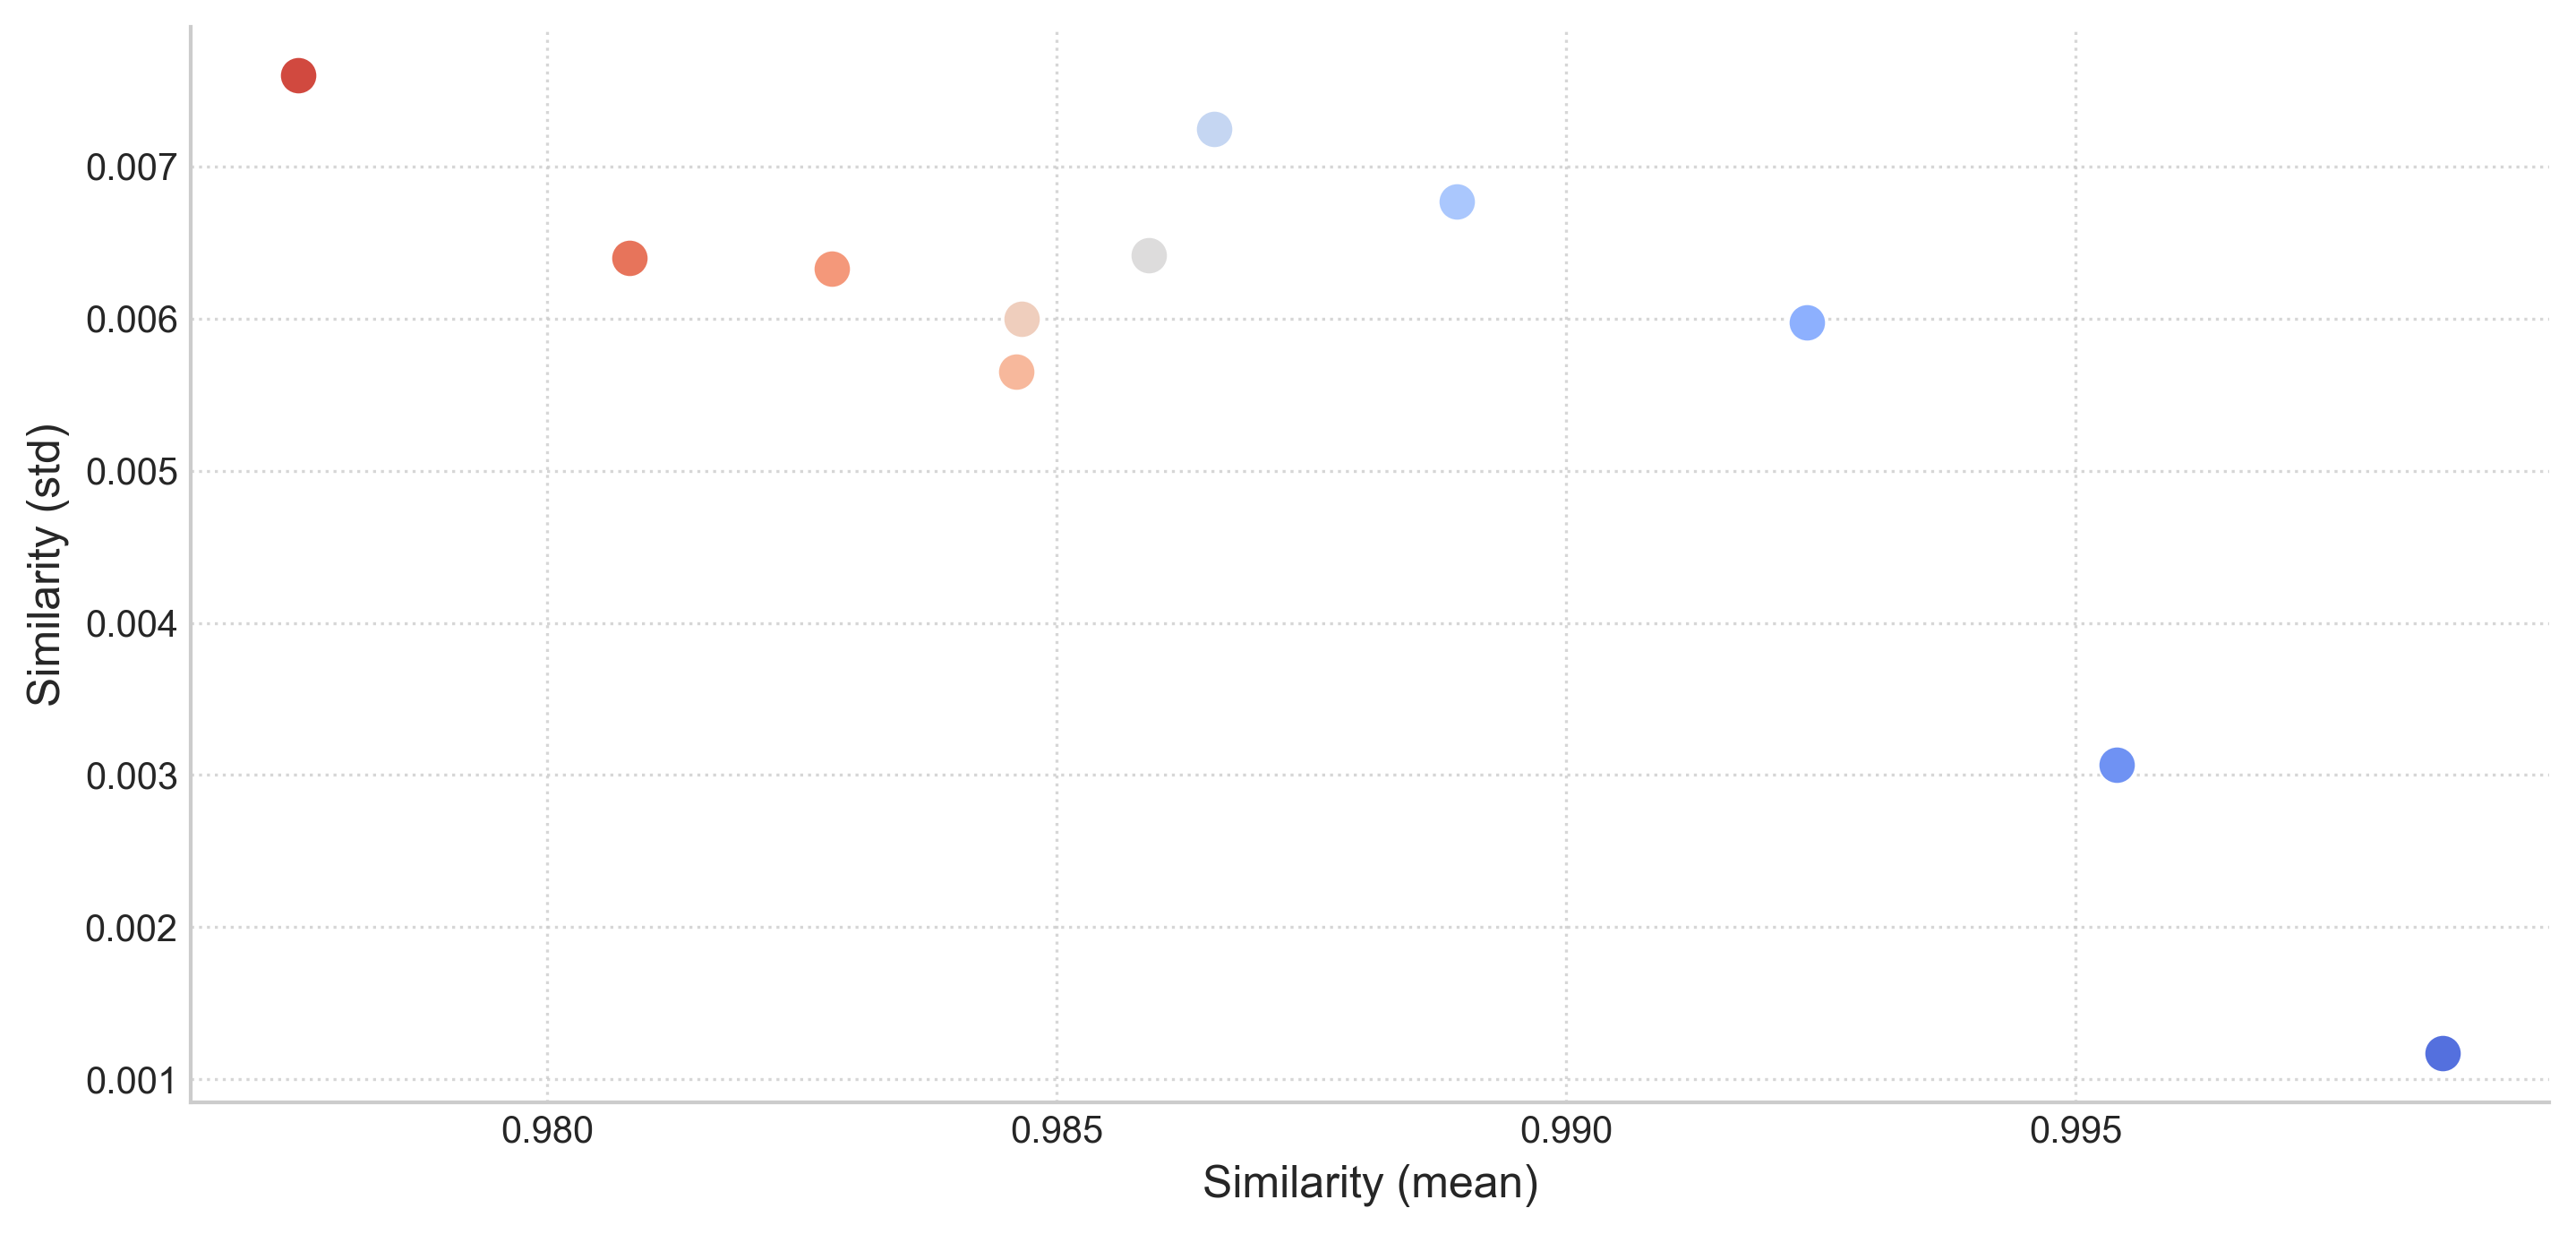
Statistical Summary
| temperature | Mean | Median | Std Dev | Min | 25% | 75% | Max | Count |
|---|---|---|---|---|---|---|---|---|
| 0 | 0.9986 | 0.9977 | 0.0012 | 0.9969 | 0.9976 | 1 | 1 | 32640 |
| 0.1 | 0.9954 | 0.9959 | 0.0031 | 0.9674 | 0.9944 | 0.9971 | 1 | 32640 |
| 0.2 | 0.9924 | 0.9943 | 0.006 | 0.9579 | 0.9913 | 0.996 | 0.9994 | 32640 |
| 0.3 | 0.9889 | 0.9912 | 0.0068 | 0.9591 | 0.9851 | 0.994 | 0.999 | 32640 |
| 0.4 | 0.9865 | 0.9884 | 0.0072 | 0.9546 | 0.9814 | 0.9924 | 0.9985 | 32640 |
| 0.5 | 0.9859 | 0.9872 | 0.0064 | 0.9537 | 0.9817 | 0.991 | 0.9985 | 32640 |
| 0.6 | 0.9847 | 0.9851 | 0.006 | 0.9569 | 0.9806 | 0.9894 | 0.9982 | 32640 |
| 0.7 | 0.9846 | 0.9852 | 0.0056 | 0.9554 | 0.981 | 0.9889 | 0.9977 | 32640 |
| 0.8 | 0.9828 | 0.9836 | 0.0063 | 0.9452 | 0.9791 | 0.9874 | 0.9969 | 32640 |
| 0.9 | 0.9808 | 0.9816 | 0.0064 | 0.9425 | 0.9772 | 0.9853 | 0.9968 | 32640 |
| 1 | 0.9776 | 0.9785 | 0.0076 | 0.9298 | 0.9733 | 0.9829 | 0.9966 | 32640 |
Generated by LLM Thermometer v0.5.2