llm-thermometer
Report
What's the meaning of life?
- Id:
20250304T003734 - Language Model:
unsloth/Mistral-Small-24B-Instruct-2501-bnb-4bit - Embedding Model:
jinaai/jina-embeddings-v2-base-en
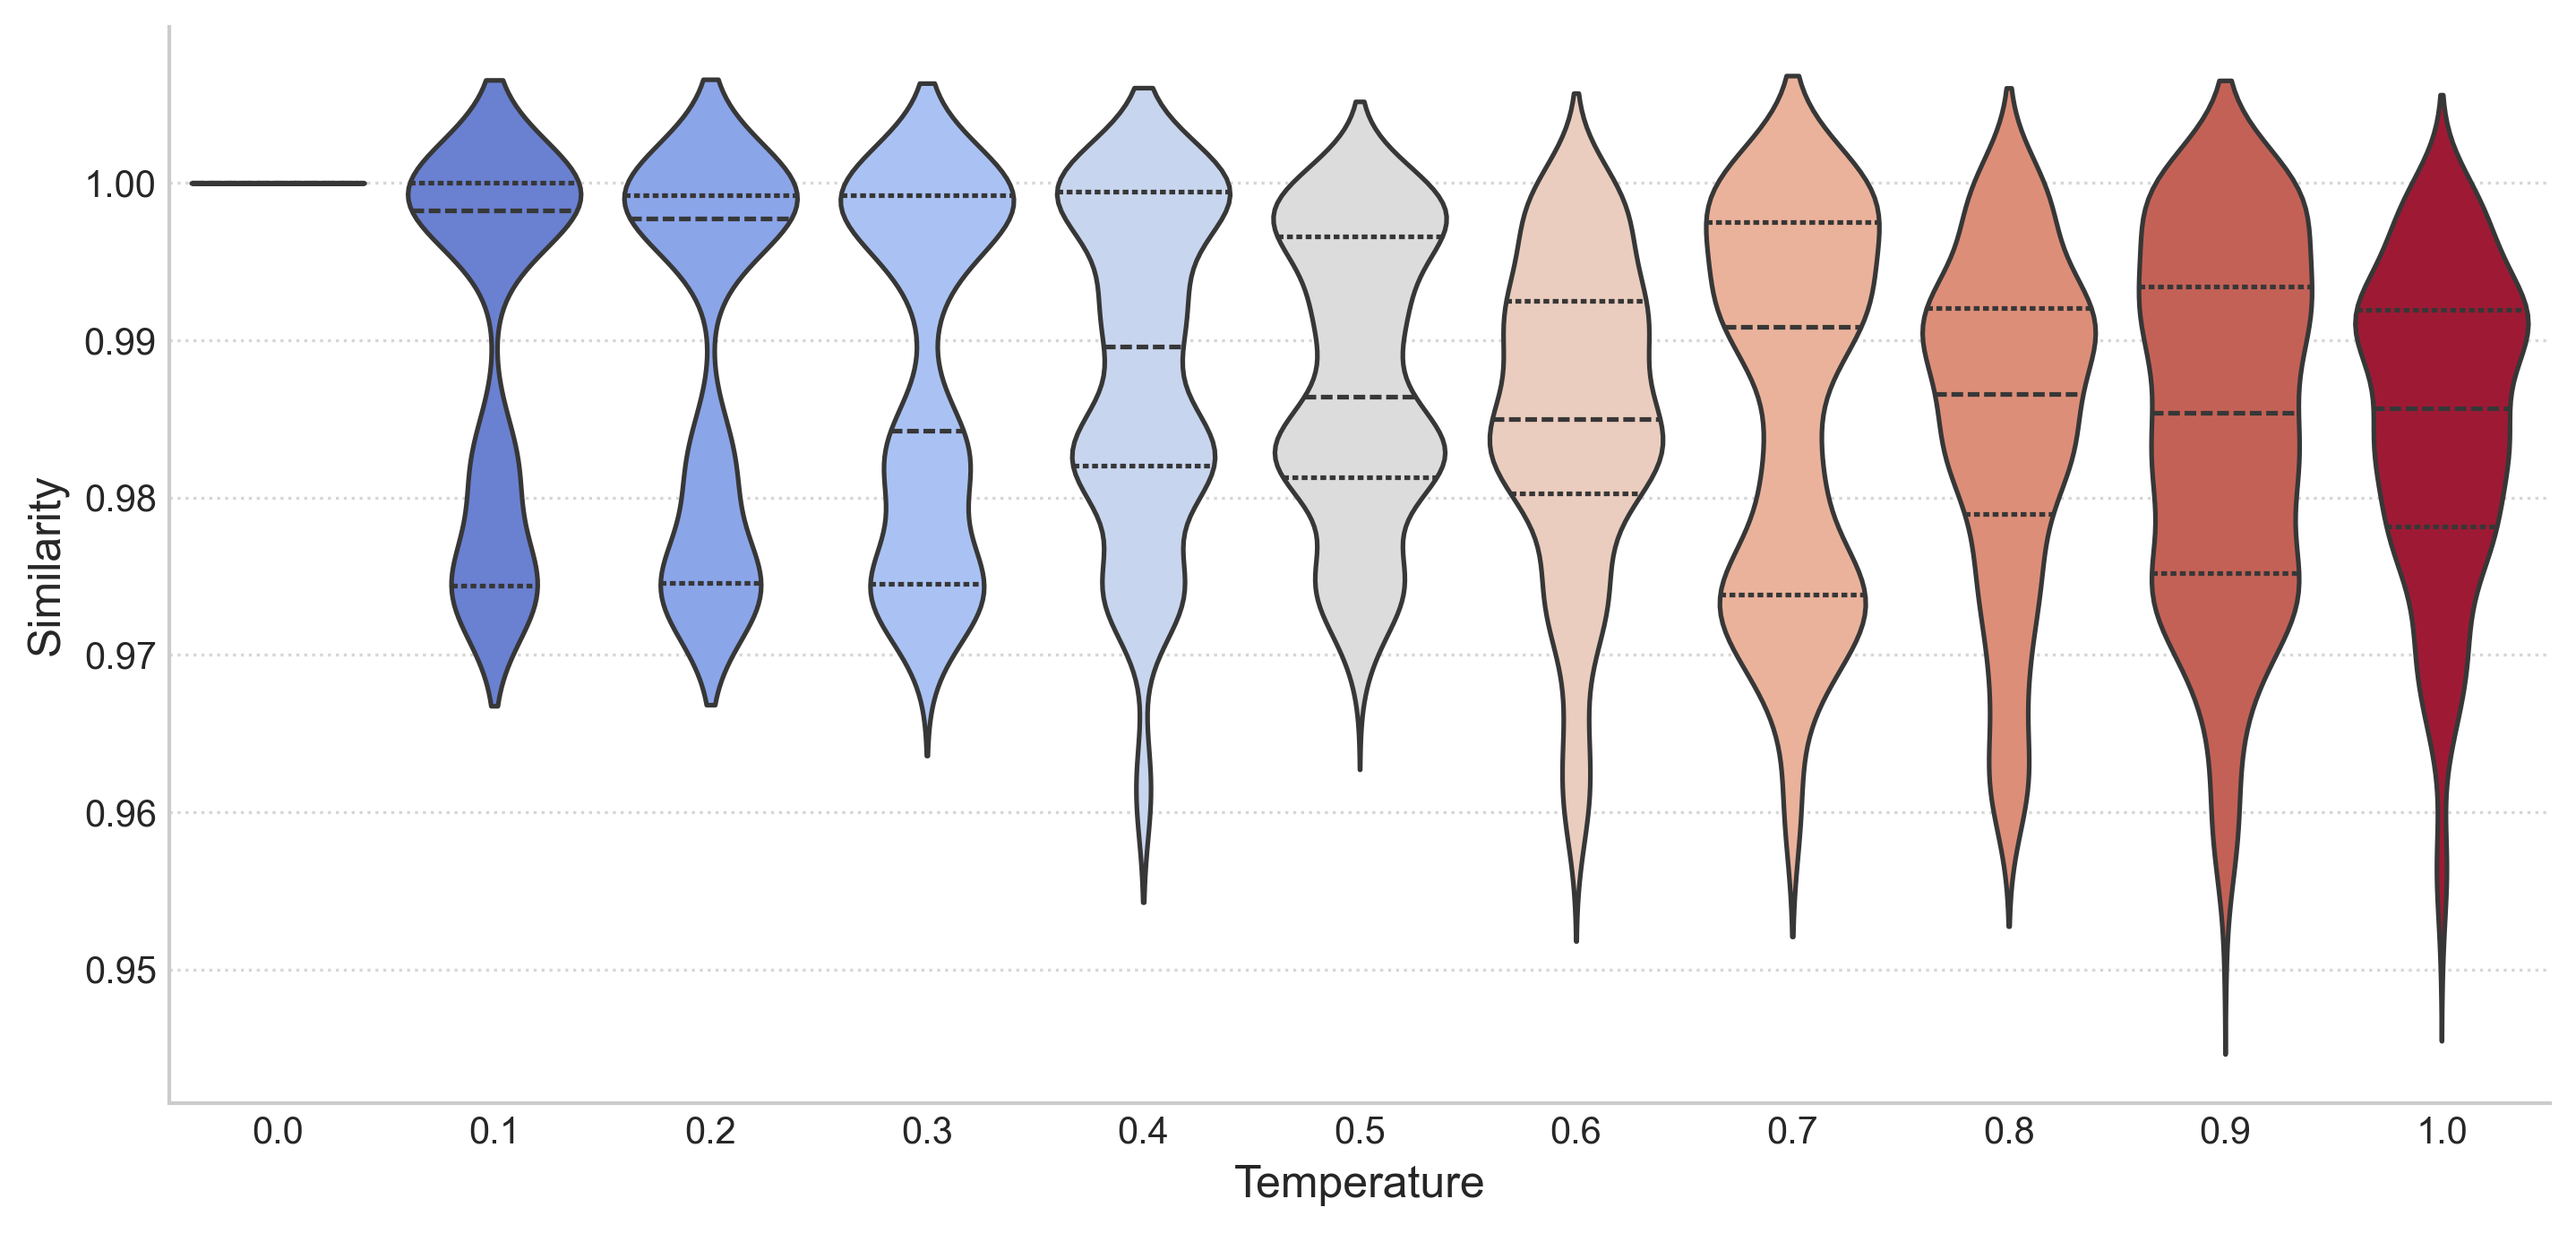
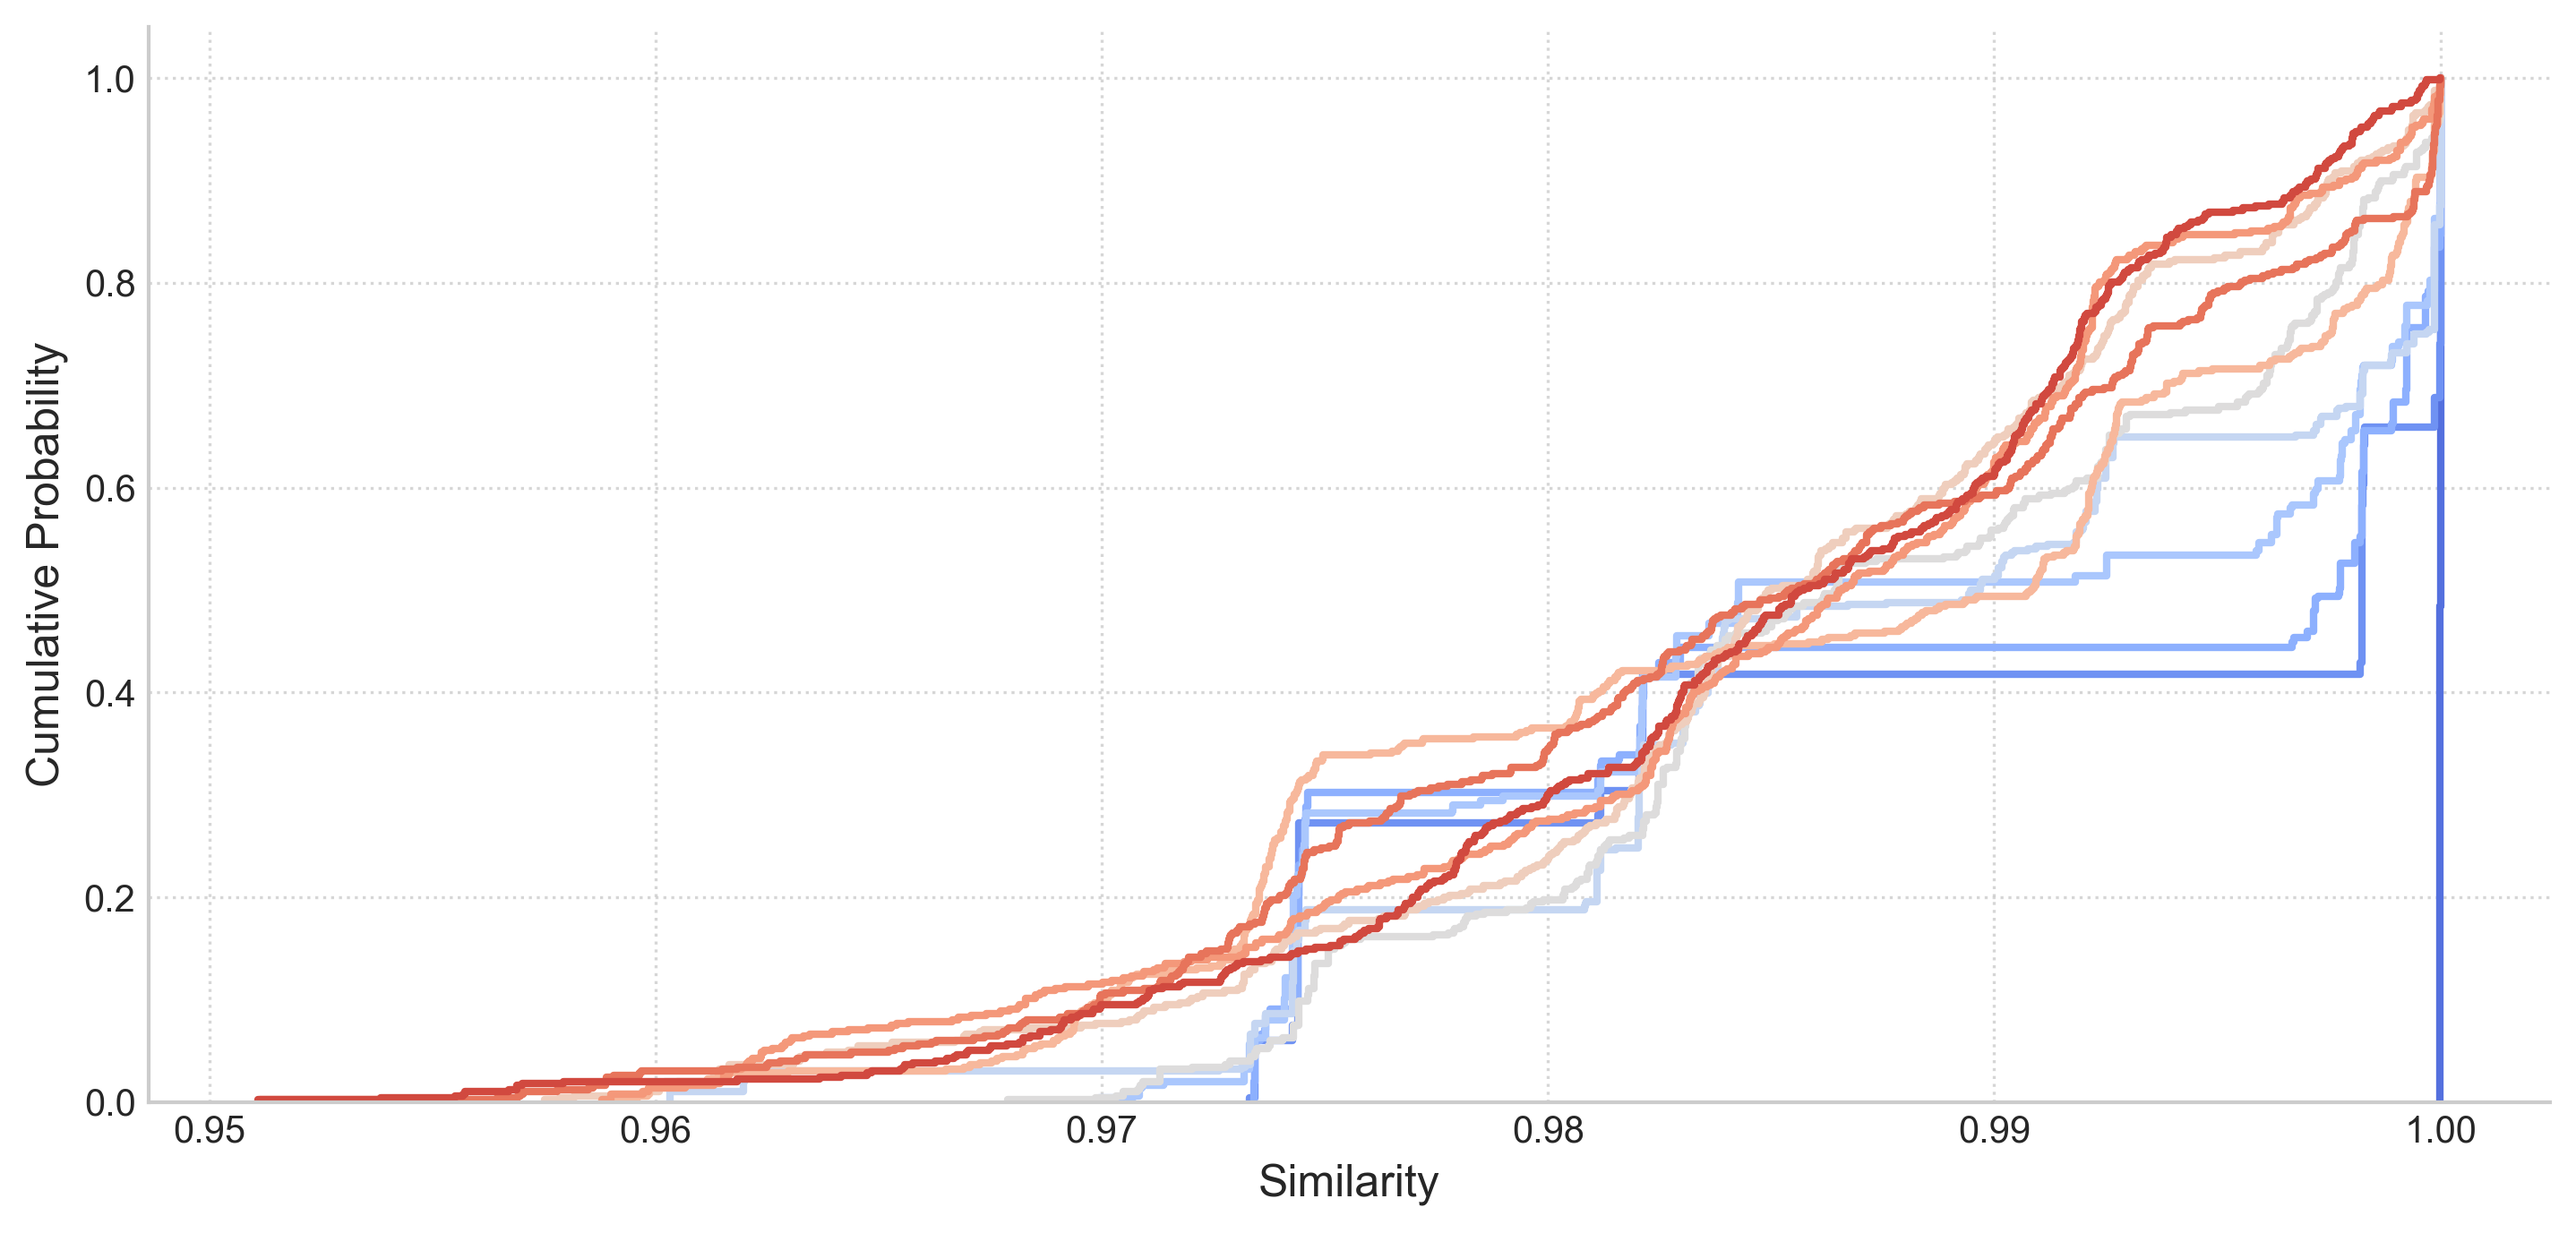
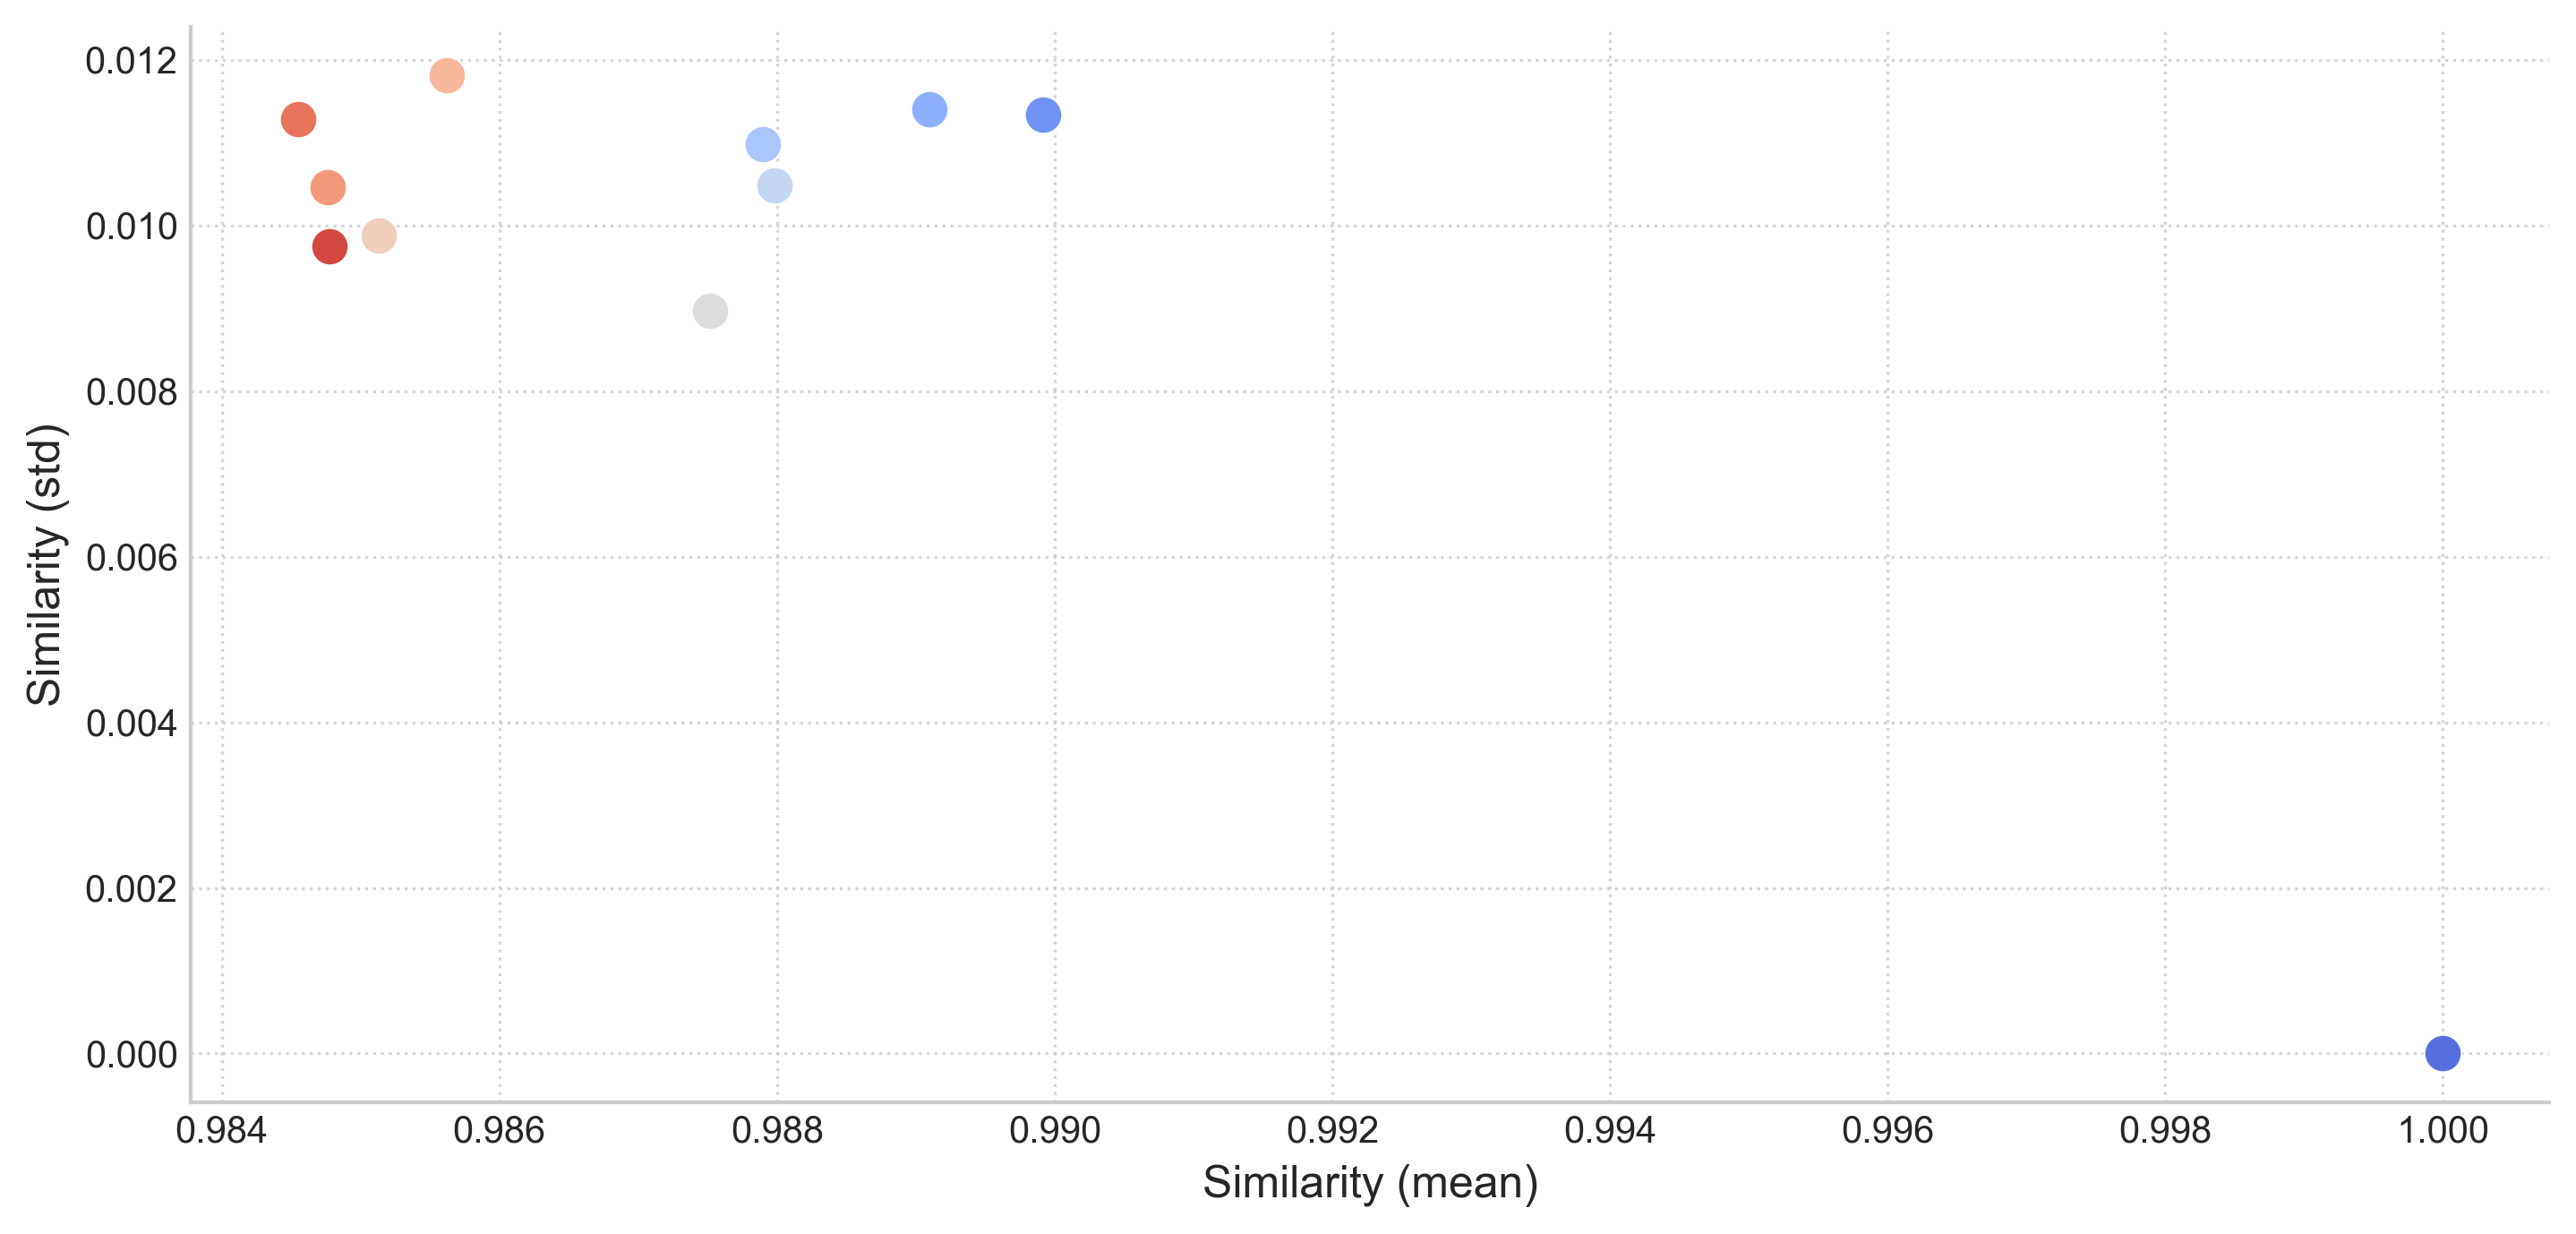
Statistical Summary
| temperature | Mean | Median | Std Dev | Min | 25% | 75% | Max | Count |
|---|---|---|---|---|---|---|---|---|
| 0 | 1 | 1 | 0 | 1 | 1 | 1 | 1 | 496 |
| 0.1 | 0.9899 | 0.9982 | 0.0113 | 0.9733 | 0.9744 | 1 | 1 | 496 |
| 0.2 | 0.9891 | 0.9977 | 0.0114 | 0.9734 | 0.9746 | 0.9992 | 1 | 496 |
| 0.3 | 0.9879 | 0.9843 | 0.011 | 0.9699 | 0.9745 | 0.9992 | 1 | 496 |
| 0.4 | 0.988 | 0.9896 | 0.0105 | 0.9603 | 0.982 | 0.9995 | 1 | 496 |
| 0.5 | 0.9875 | 0.9864 | 0.009 | 0.9679 | 0.9813 | 0.9966 | 1 | 496 |
| 0.6 | 0.9851 | 0.985 | 0.0099 | 0.9575 | 0.9803 | 0.9925 | 1 | 496 |
| 0.7 | 0.9856 | 0.9908 | 0.0118 | 0.9589 | 0.9738 | 0.9975 | 1 | 496 |
| 0.8 | 0.9848 | 0.9866 | 0.0105 | 0.9588 | 0.9789 | 0.9921 | 1 | 496 |
| 0.9 | 0.9846 | 0.9854 | 0.0113 | 0.9511 | 0.9752 | 0.9934 | 1 | 496 |
| 1 | 0.9848 | 0.9857 | 0.0097 | 0.9511 | 0.9782 | 0.9919 | 1 | 496 |
Generated by LLM Thermometer v0.5.2