llm-thermometer
Report
What will technology look like in 2050?
- Id:
20250304T080143 - Language Model:
unsloth/Meta-Llama-3.1-8B-Instruct-bnb-4bit - Embedding Model:
jinaai/jina-embeddings-v2-base-en
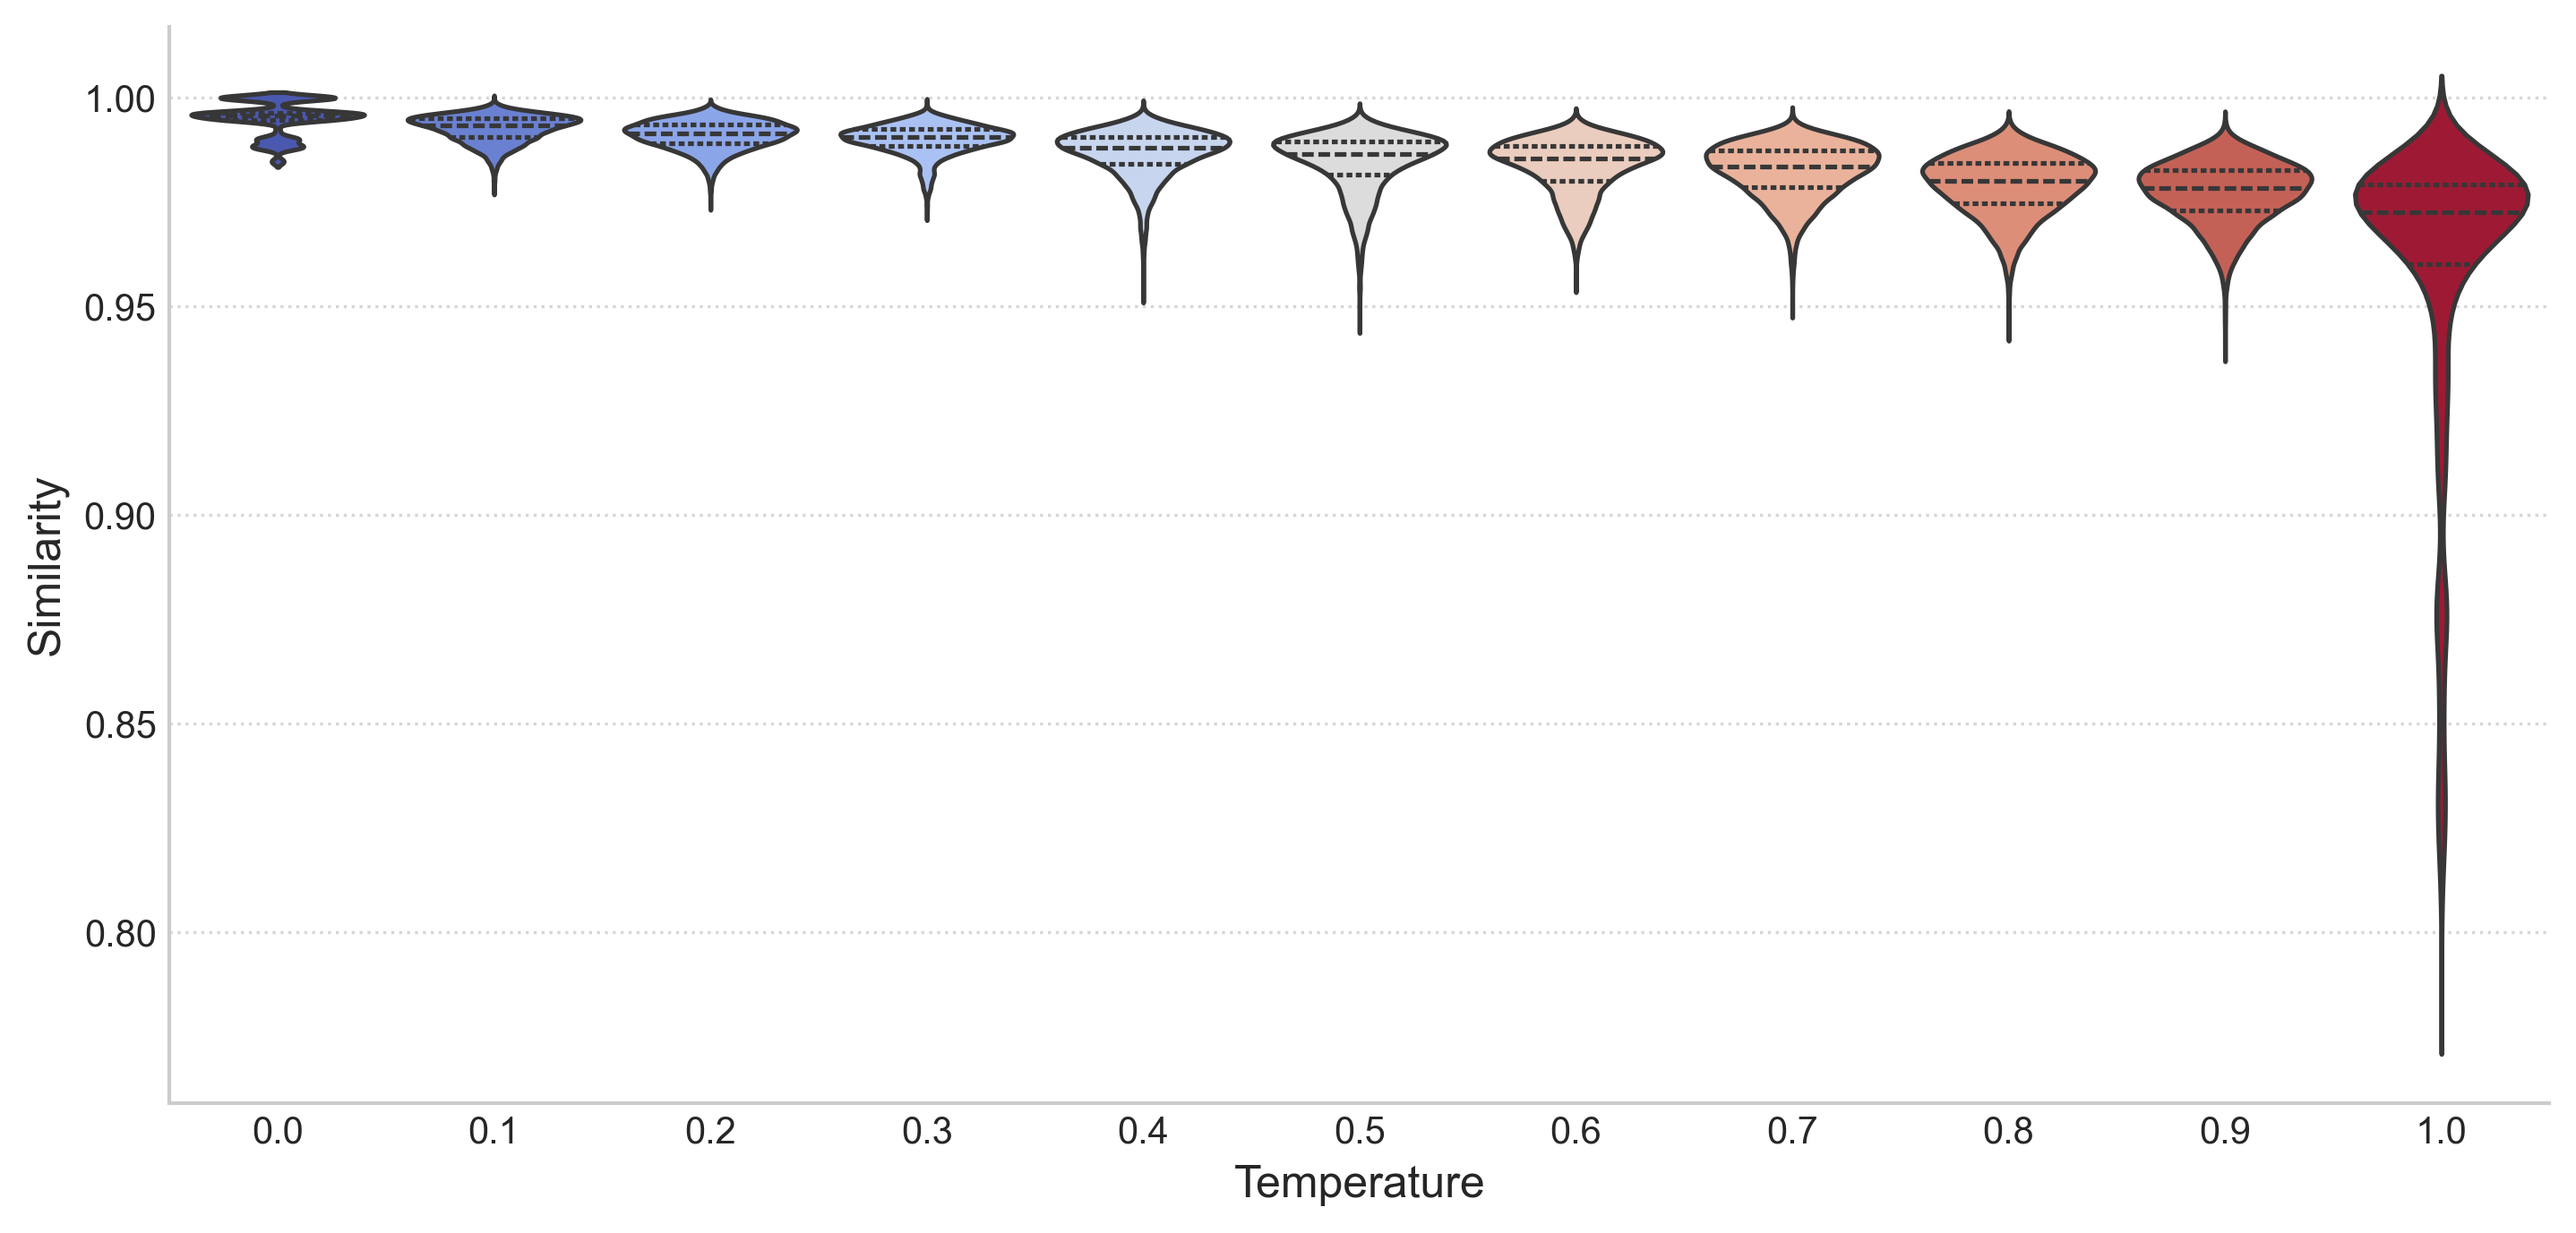
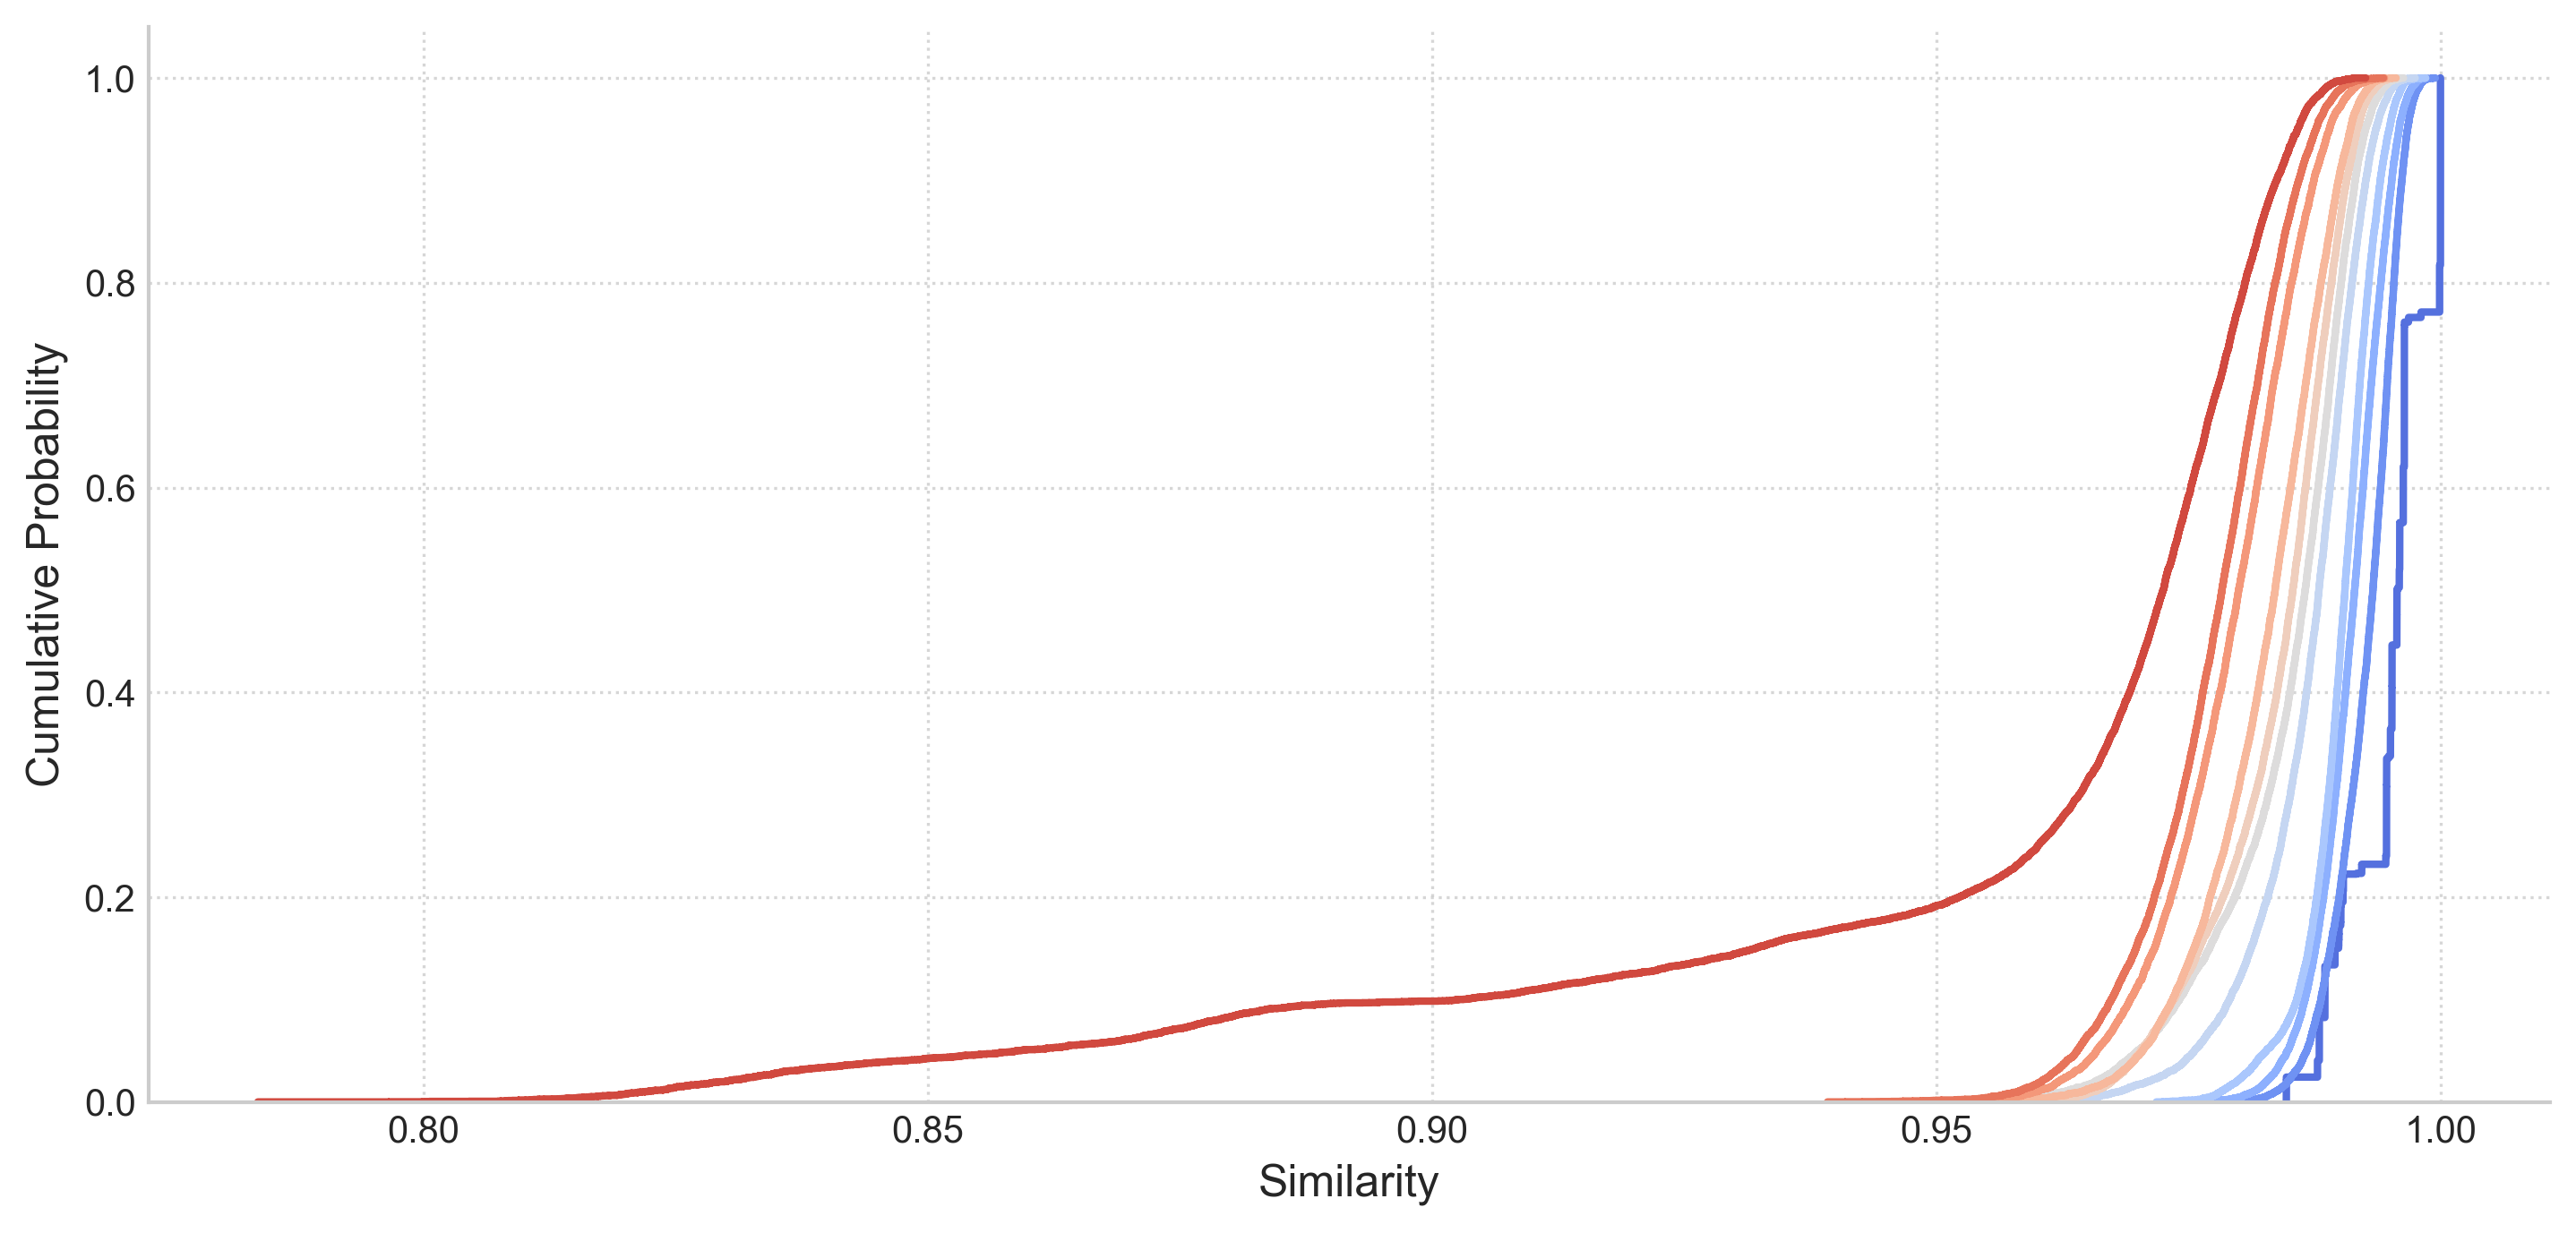
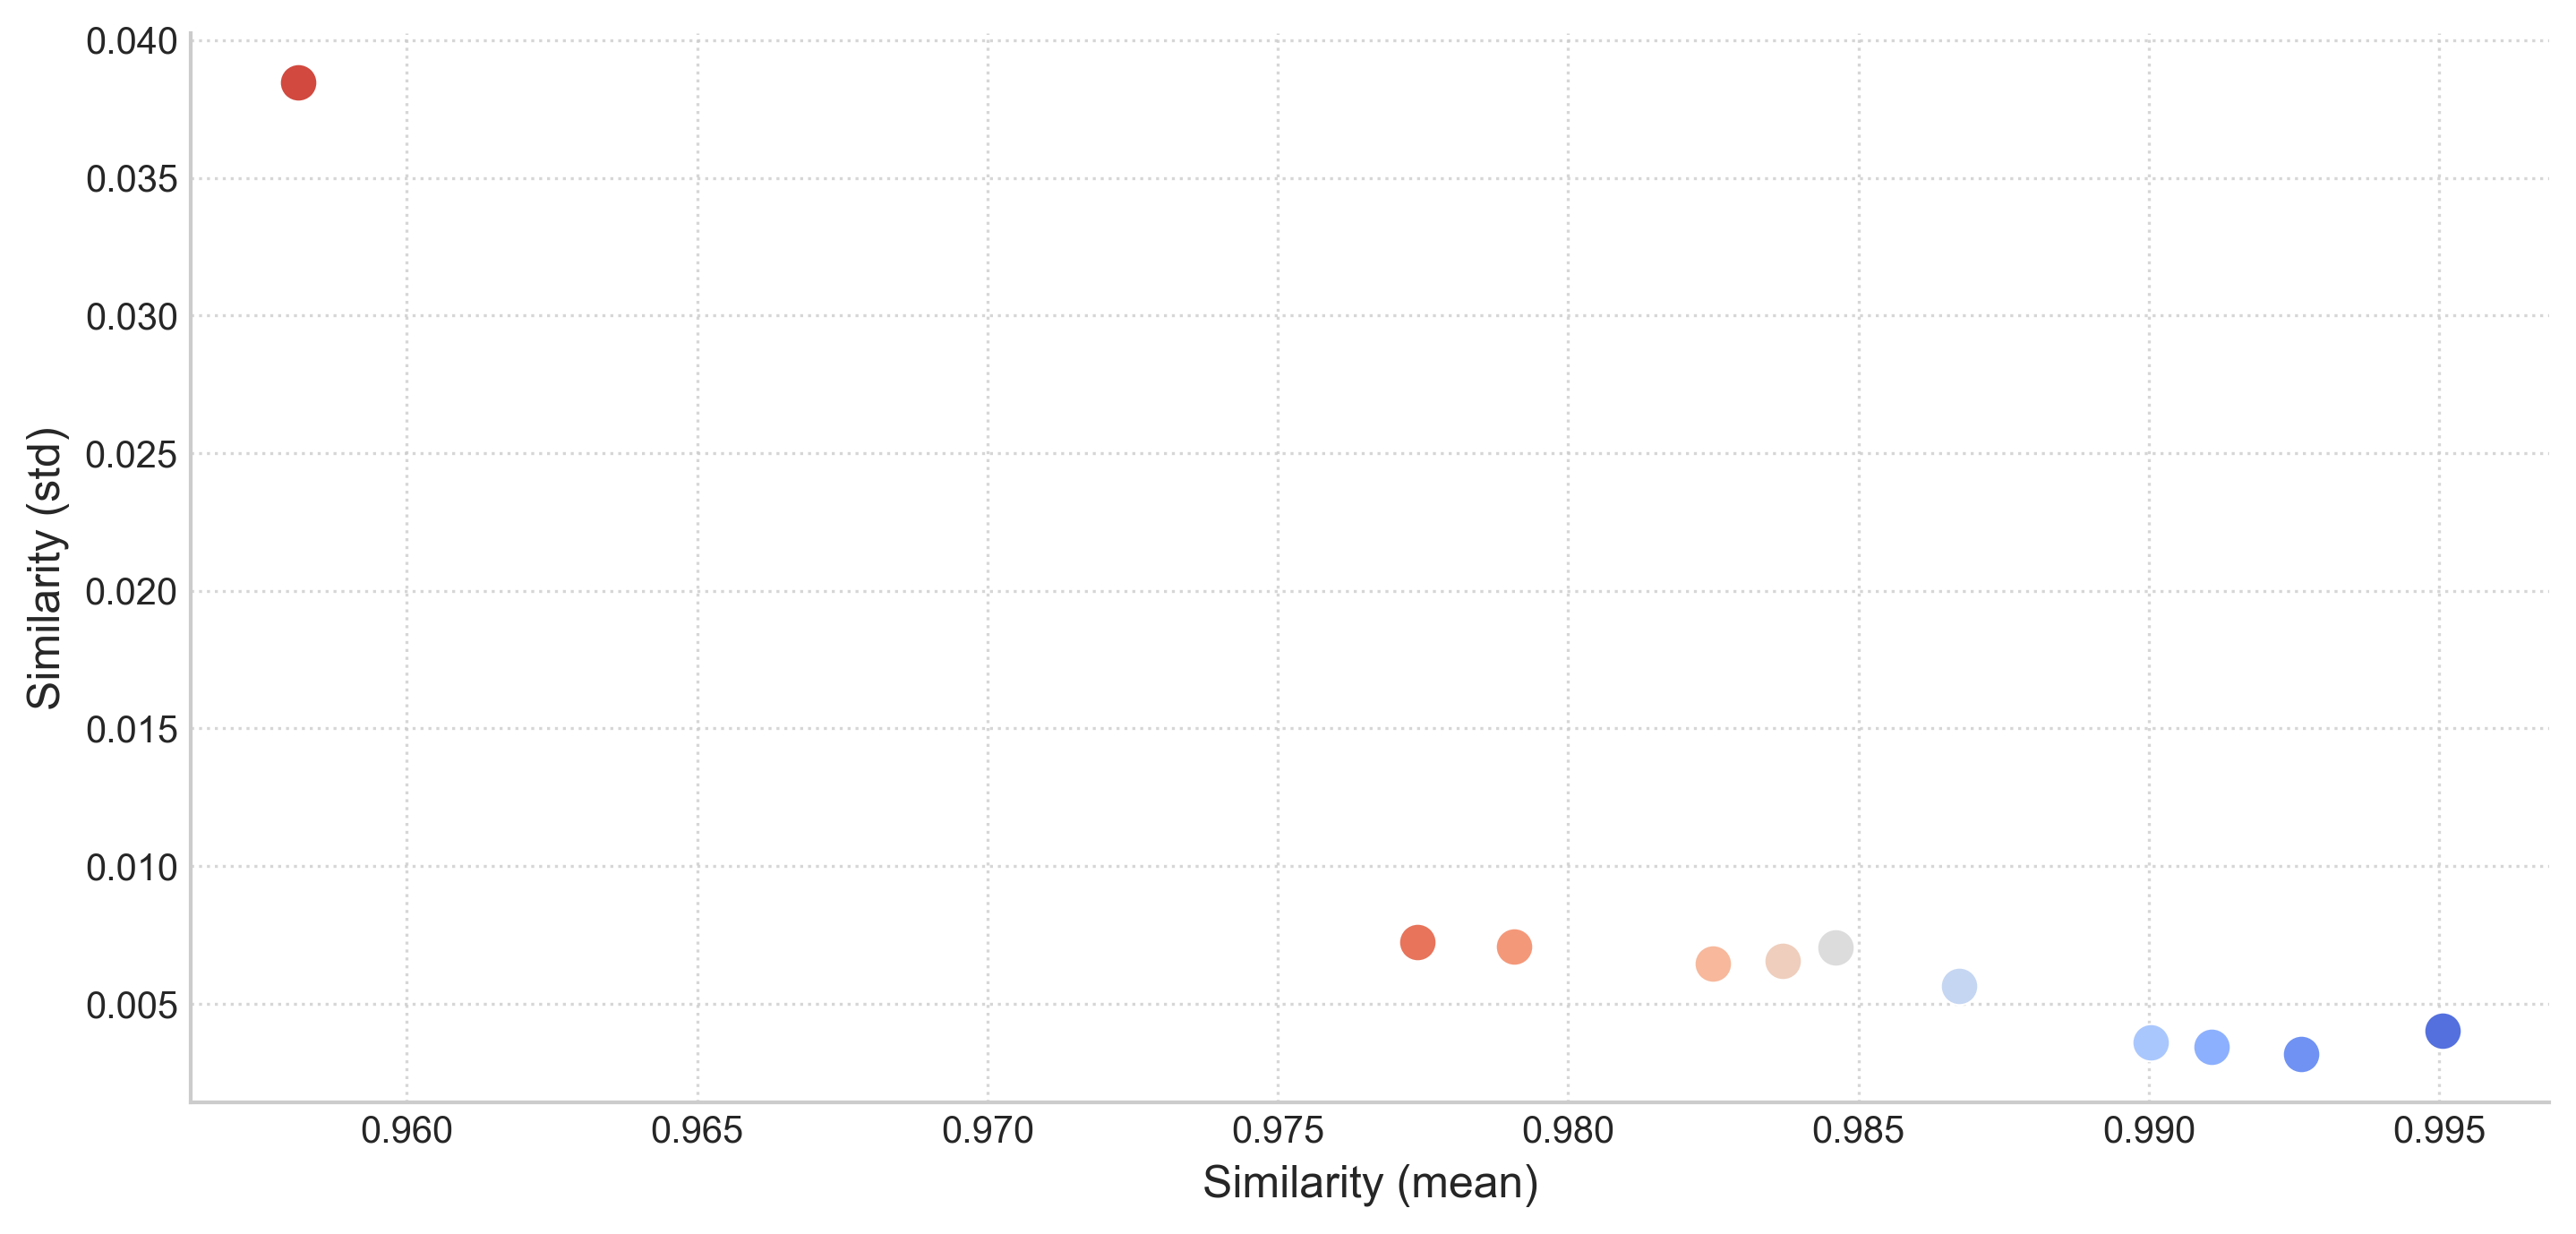
Statistical Summary
| temperature | Mean | Median | Std Dev | Min | 25% | 75% | Max | Count |
|---|---|---|---|---|---|---|---|---|
| 0 | 0.9951 | 0.9957 | 0.004 | 0.9847 | 0.9946 | 0.9964 | 1 | 8128 |
| 0.1 | 0.9926 | 0.9933 | 0.0032 | 0.9778 | 0.9906 | 0.995 | 0.9995 | 8128 |
| 0.2 | 0.9911 | 0.9915 | 0.0034 | 0.9742 | 0.989 | 0.9936 | 0.9985 | 8128 |
| 0.3 | 0.99 | 0.9905 | 0.0036 | 0.9718 | 0.9884 | 0.9924 | 0.9985 | 8128 |
| 0.4 | 0.9867 | 0.9879 | 0.0056 | 0.9528 | 0.9842 | 0.9906 | 0.9975 | 8128 |
| 0.5 | 0.9846 | 0.9866 | 0.007 | 0.9459 | 0.9815 | 0.9896 | 0.9963 | 8128 |
| 0.6 | 0.9837 | 0.9854 | 0.0066 | 0.9555 | 0.9801 | 0.9885 | 0.9953 | 8128 |
| 0.7 | 0.9825 | 0.9836 | 0.0064 | 0.9494 | 0.9786 | 0.9873 | 0.9956 | 8128 |
| 0.8 | 0.9791 | 0.98 | 0.0071 | 0.9441 | 0.9747 | 0.9843 | 0.9944 | 8128 |
| 0.9 | 0.9774 | 0.9783 | 0.0072 | 0.9392 | 0.9731 | 0.9827 | 0.9943 | 8128 |
| 1 | 0.9581 | 0.9725 | 0.0385 | 0.7836 | 0.9601 | 0.9793 | 0.9926 | 8128 |
Generated by LLM Thermometer v0.5.2