llm-thermometer
Report
What are the ethical implications of widespread AI adoption?
- Id:
20250304T140043 - Language Model:
unsloth/Mistral-Small-24B-Instruct-2501-bnb-4bit - Embedding Model:
jinaai/jina-embeddings-v2-base-en
Statistical Summary
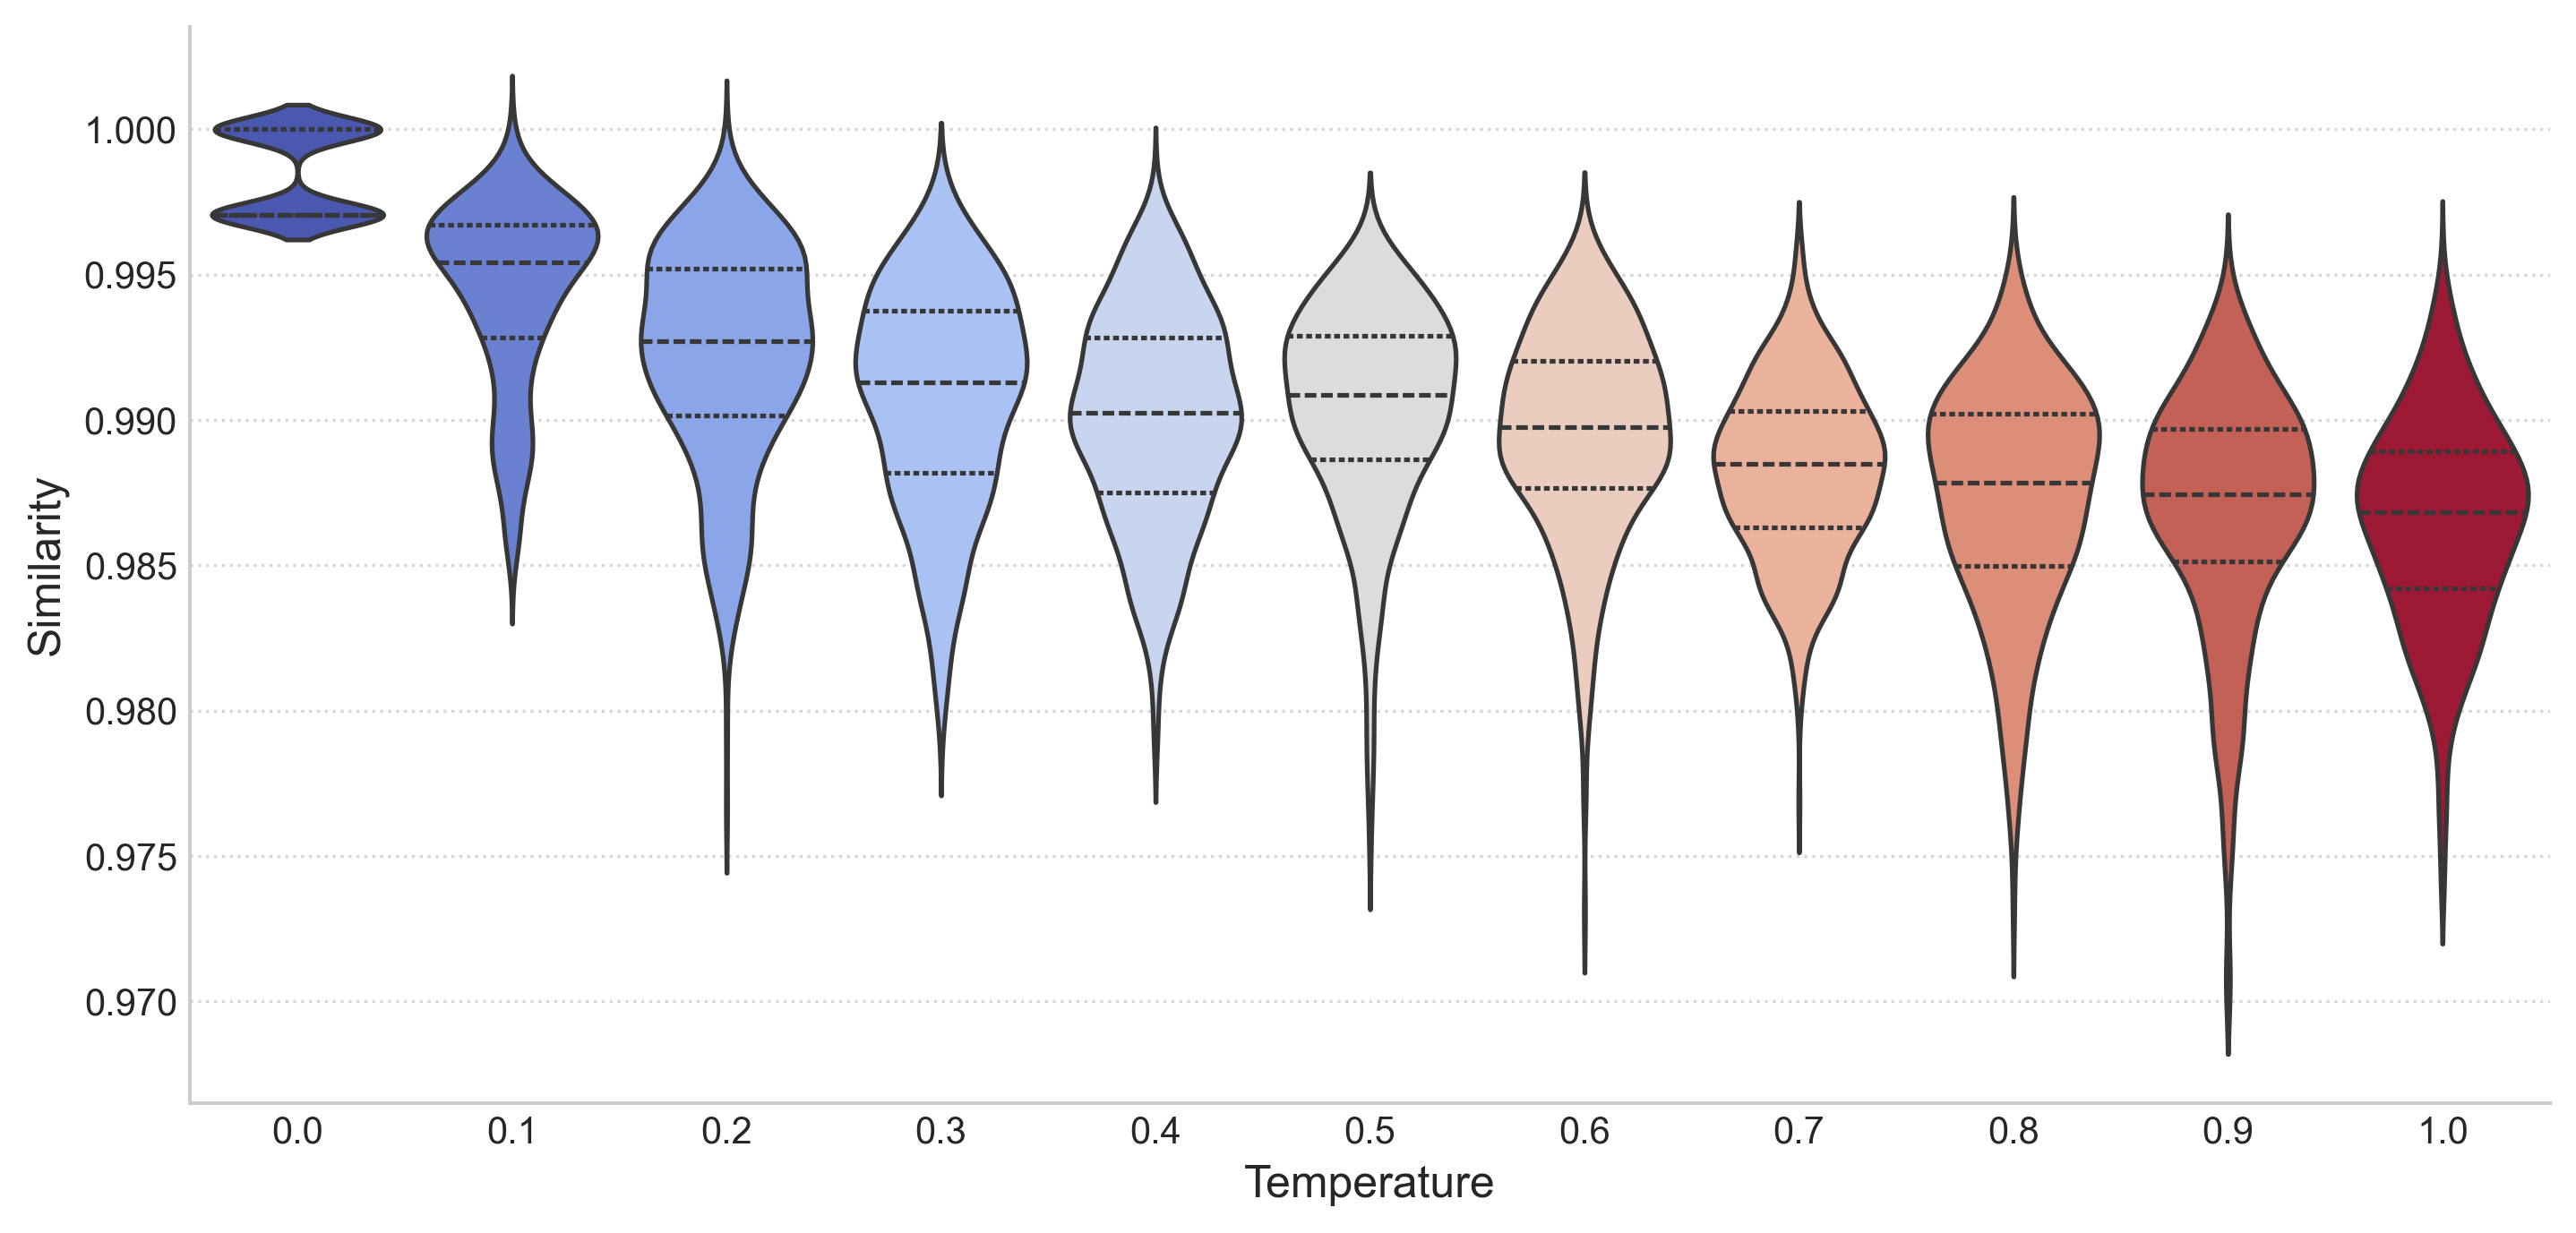
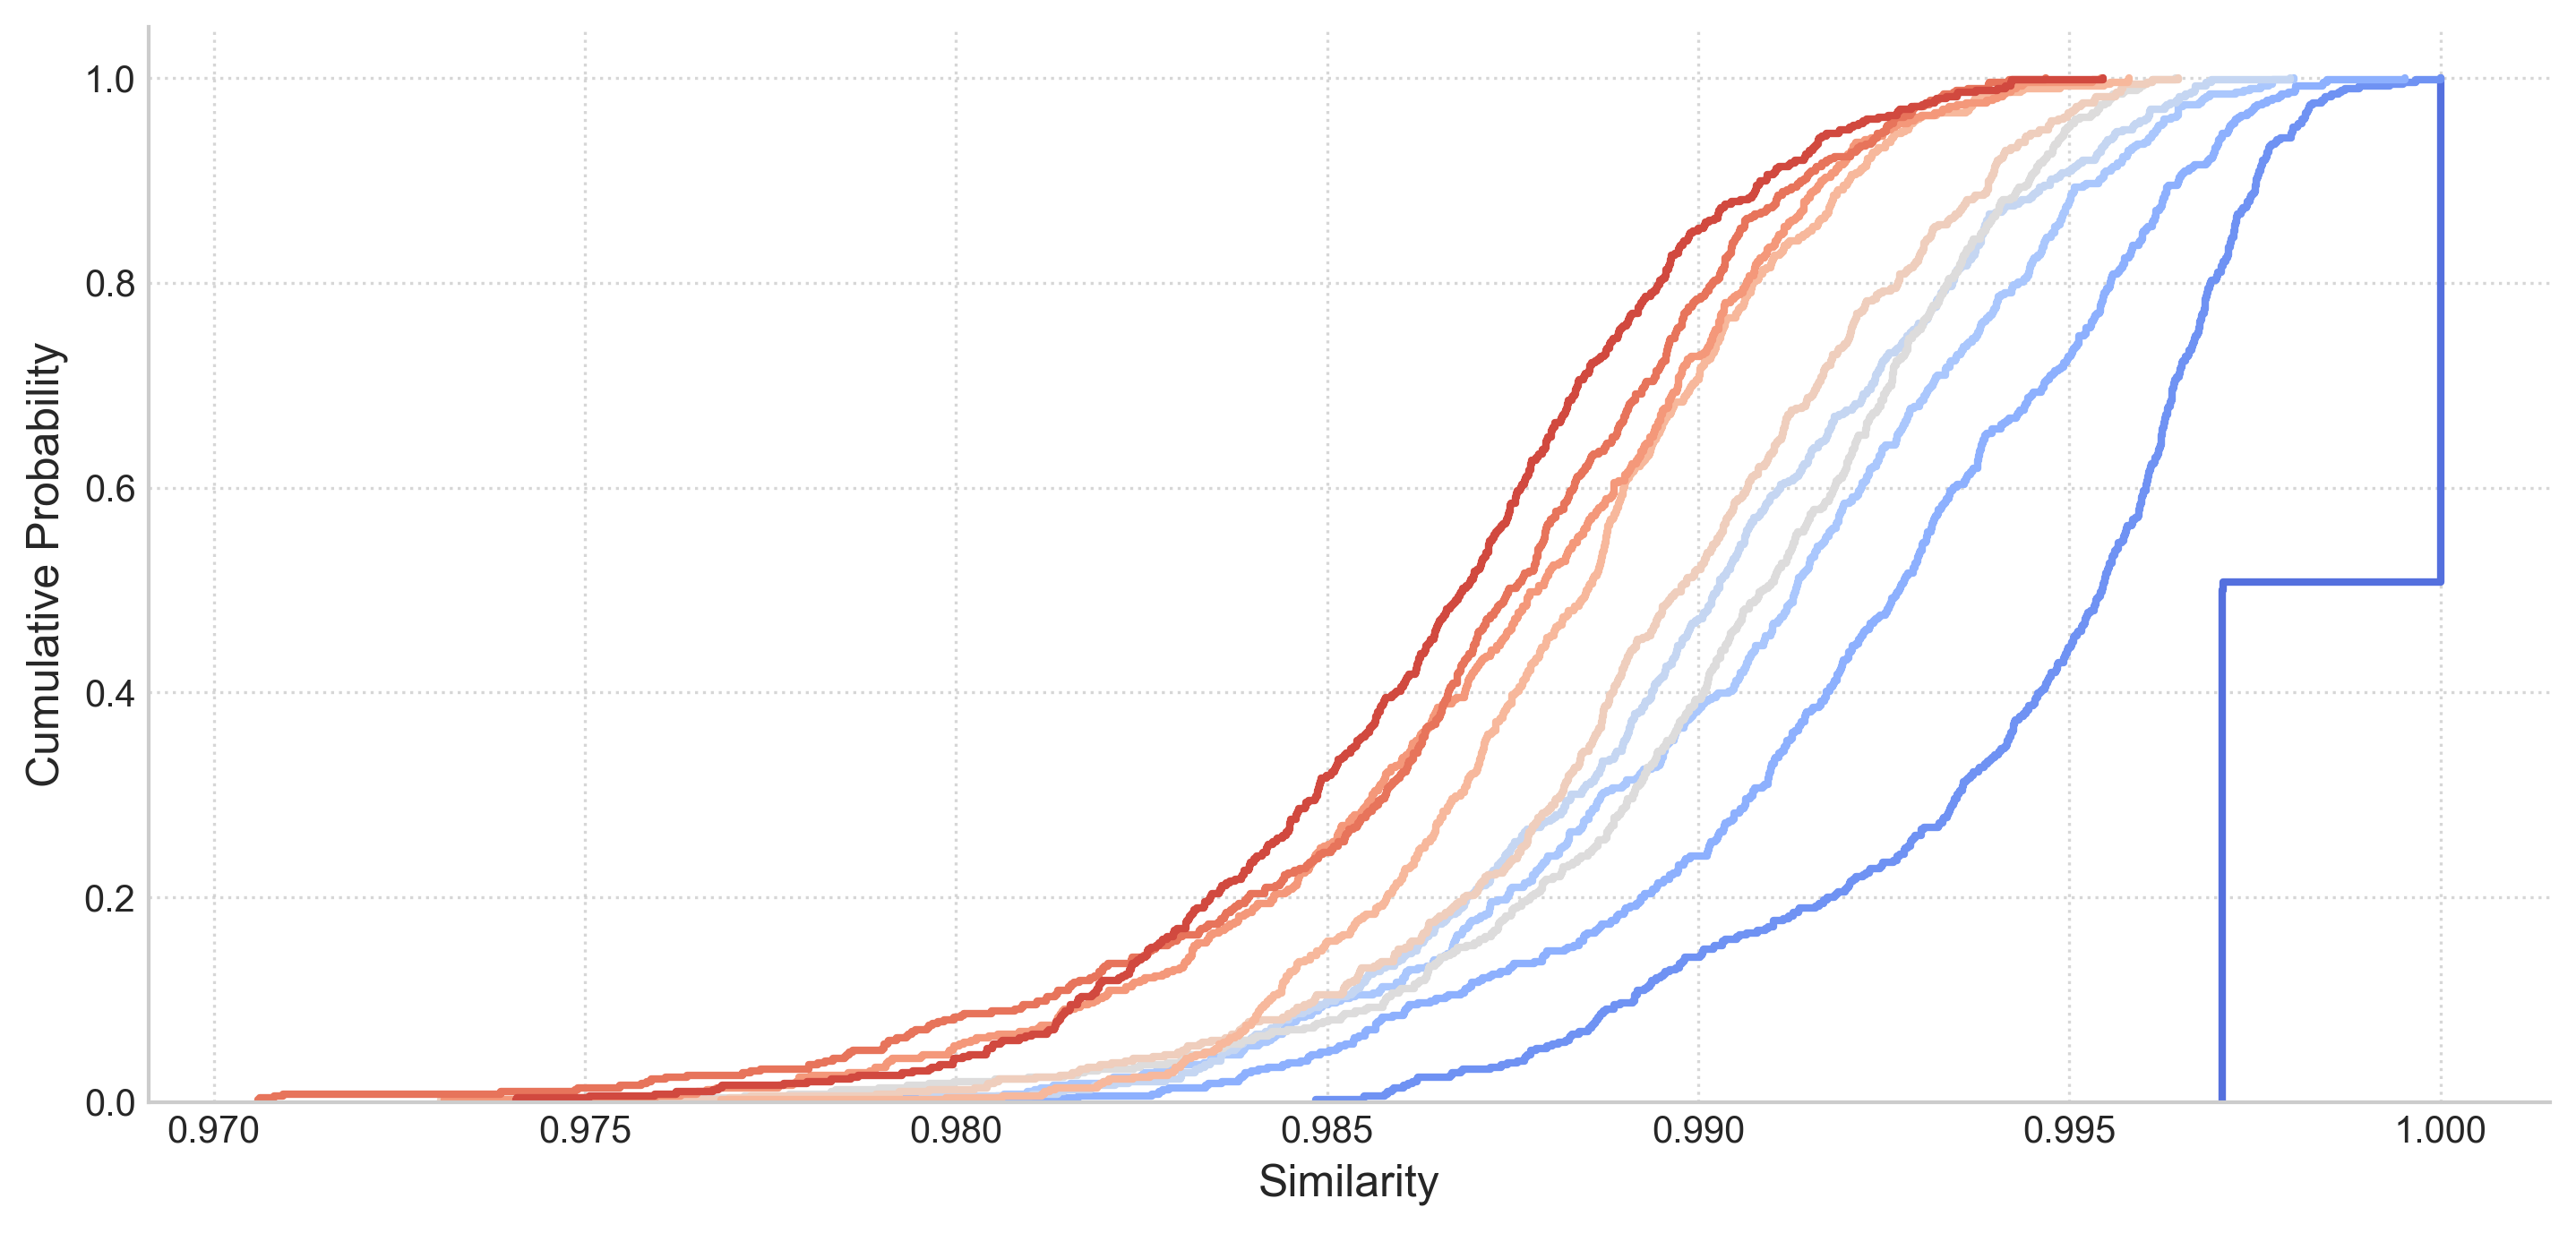
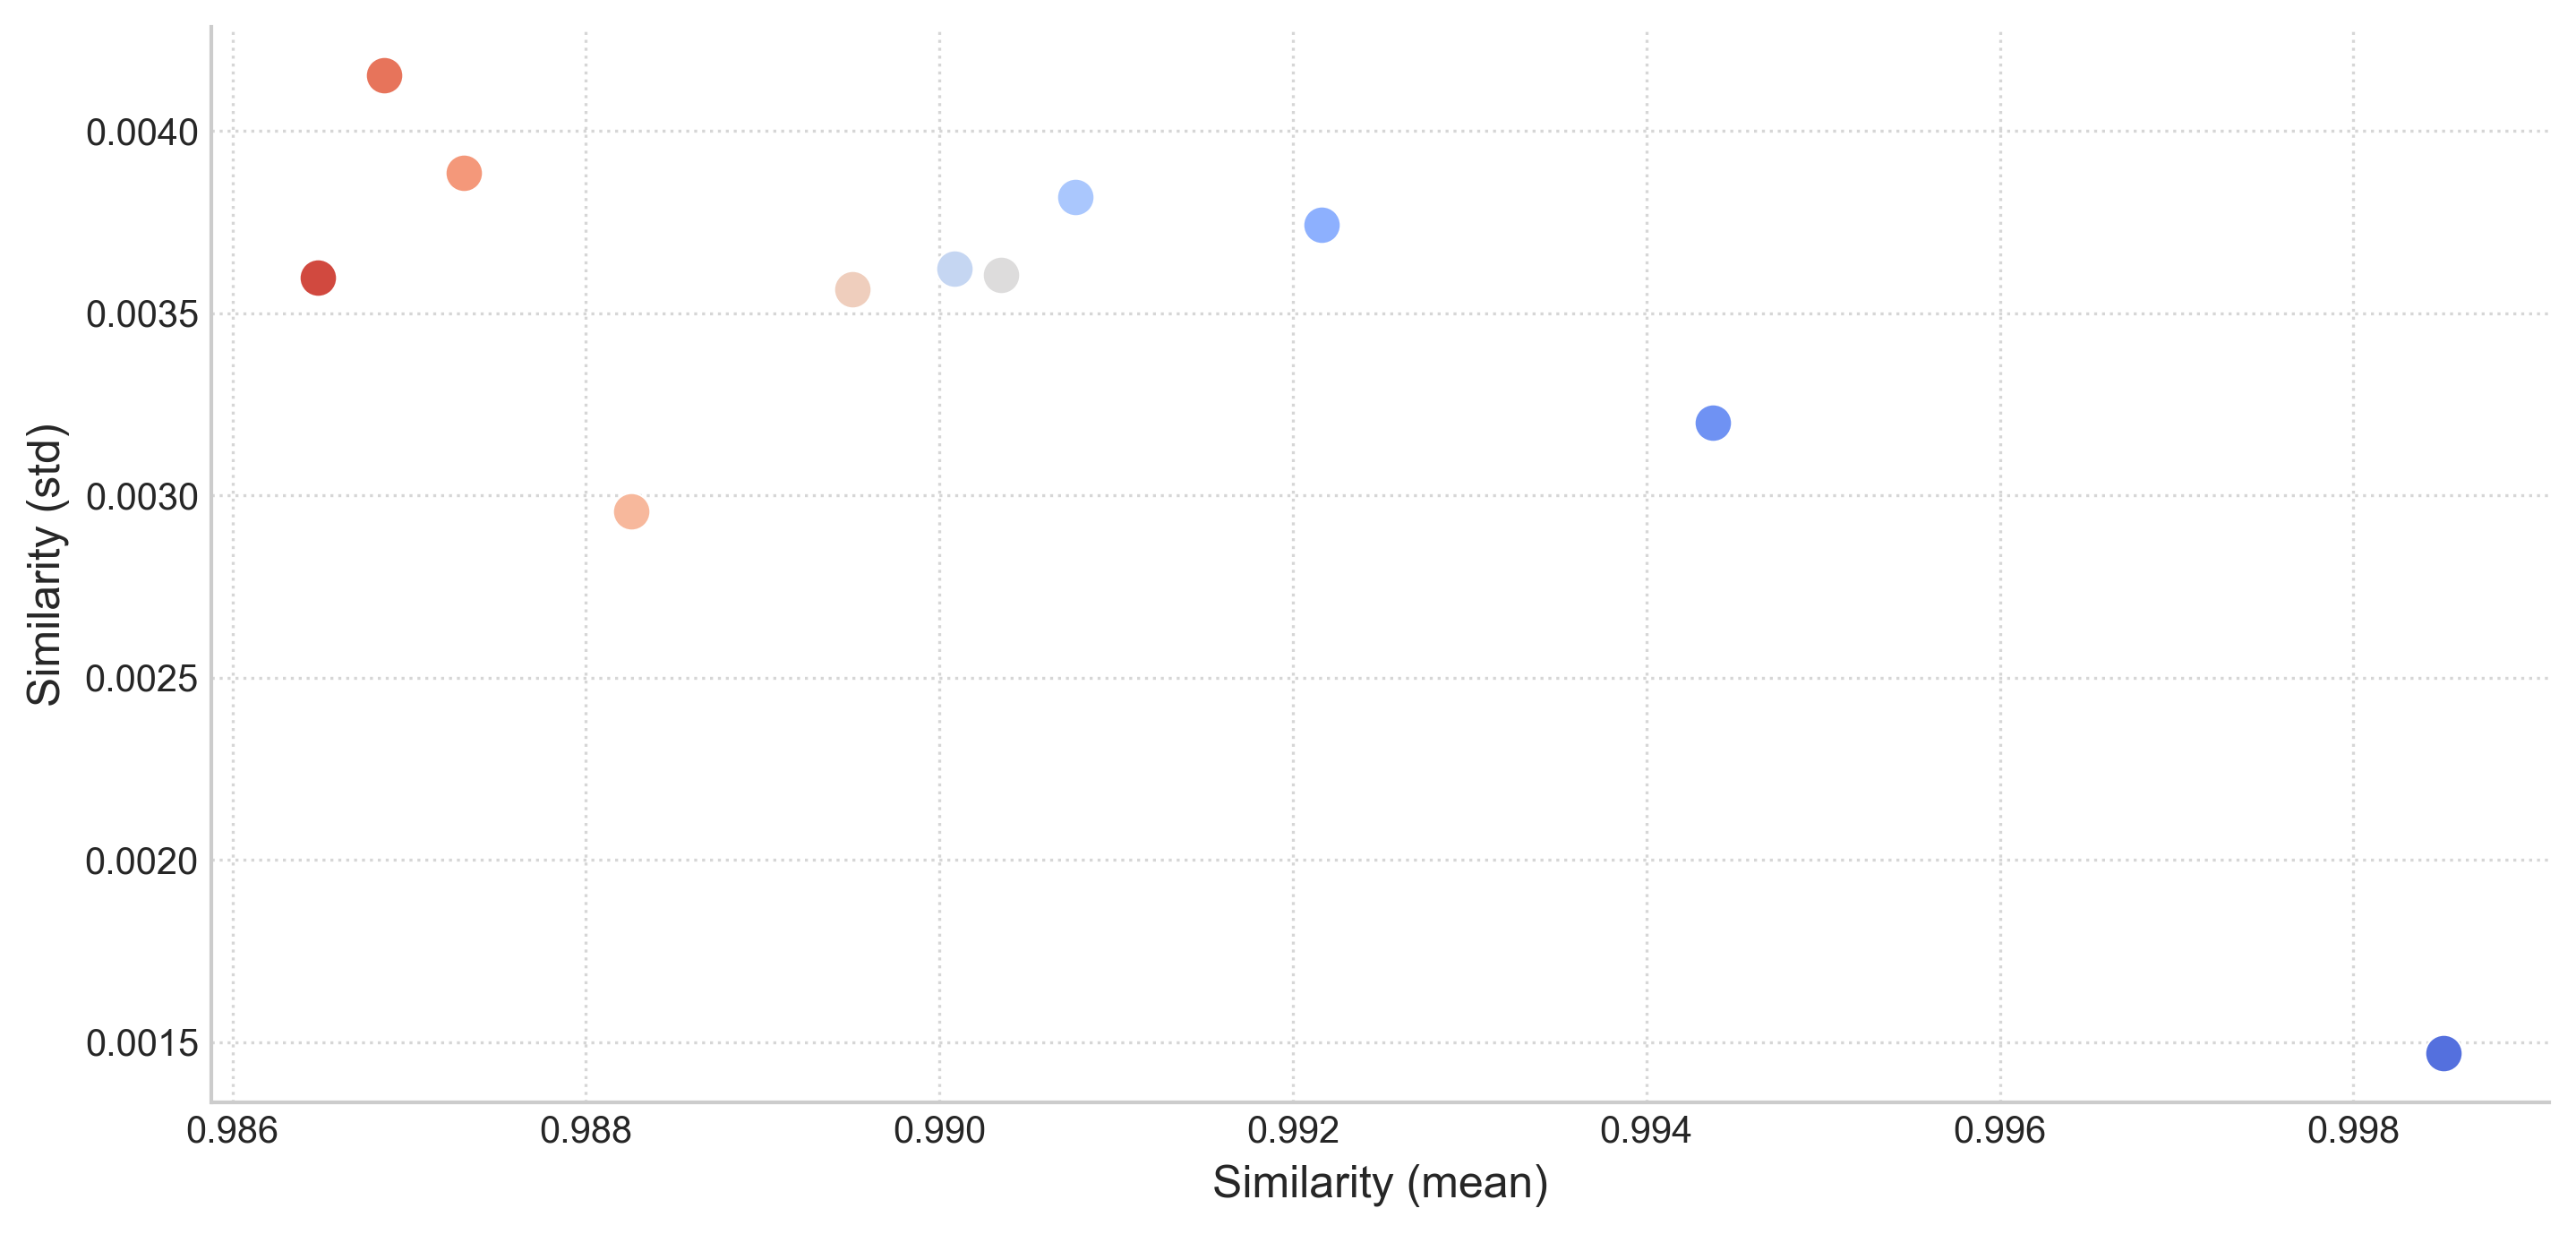
| temperature | Mean | Median | Std Dev | Min | 25% | 75% | Max | Count |
|---|---|---|---|---|---|---|---|---|
| 0 | 0.9985 | 0.9971 | 0.0015 | 0.9971 | 0.9971 | 1 | 1 | 496 |
| 0.1 | 0.9944 | 0.9954 | 0.0032 | 0.9848 | 0.9928 | 0.9967 | 1 | 496 |
| 0.2 | 0.9922 | 0.9927 | 0.0037 | 0.9766 | 0.9902 | 0.9952 | 0.9995 | 496 |
| 0.3 | 0.9908 | 0.9913 | 0.0038 | 0.9793 | 0.9882 | 0.9938 | 0.998 | 496 |
| 0.4 | 0.9901 | 0.9903 | 0.0036 | 0.979 | 0.9875 | 0.9929 | 0.998 | 496 |
| 0.5 | 0.9903 | 0.9909 | 0.0036 | 0.9753 | 0.9886 | 0.9929 | 0.9964 | 496 |
| 0.6 | 0.9895 | 0.9898 | 0.0036 | 0.9731 | 0.9877 | 0.992 | 0.9965 | 496 |
| 0.7 | 0.9883 | 0.9885 | 0.003 | 0.9768 | 0.9863 | 0.9903 | 0.9958 | 496 |
| 0.8 | 0.9873 | 0.9878 | 0.0039 | 0.9731 | 0.985 | 0.9902 | 0.9954 | 496 |
| 0.9 | 0.9869 | 0.9875 | 0.0042 | 0.9706 | 0.9851 | 0.9897 | 0.9947 | 496 |
| 1 | 0.9865 | 0.9868 | 0.0036 | 0.9741 | 0.9842 | 0.9889 | 0.9955 | 496 |
Generated by LLM Thermometer v0.5.2