llm-thermometer
Report
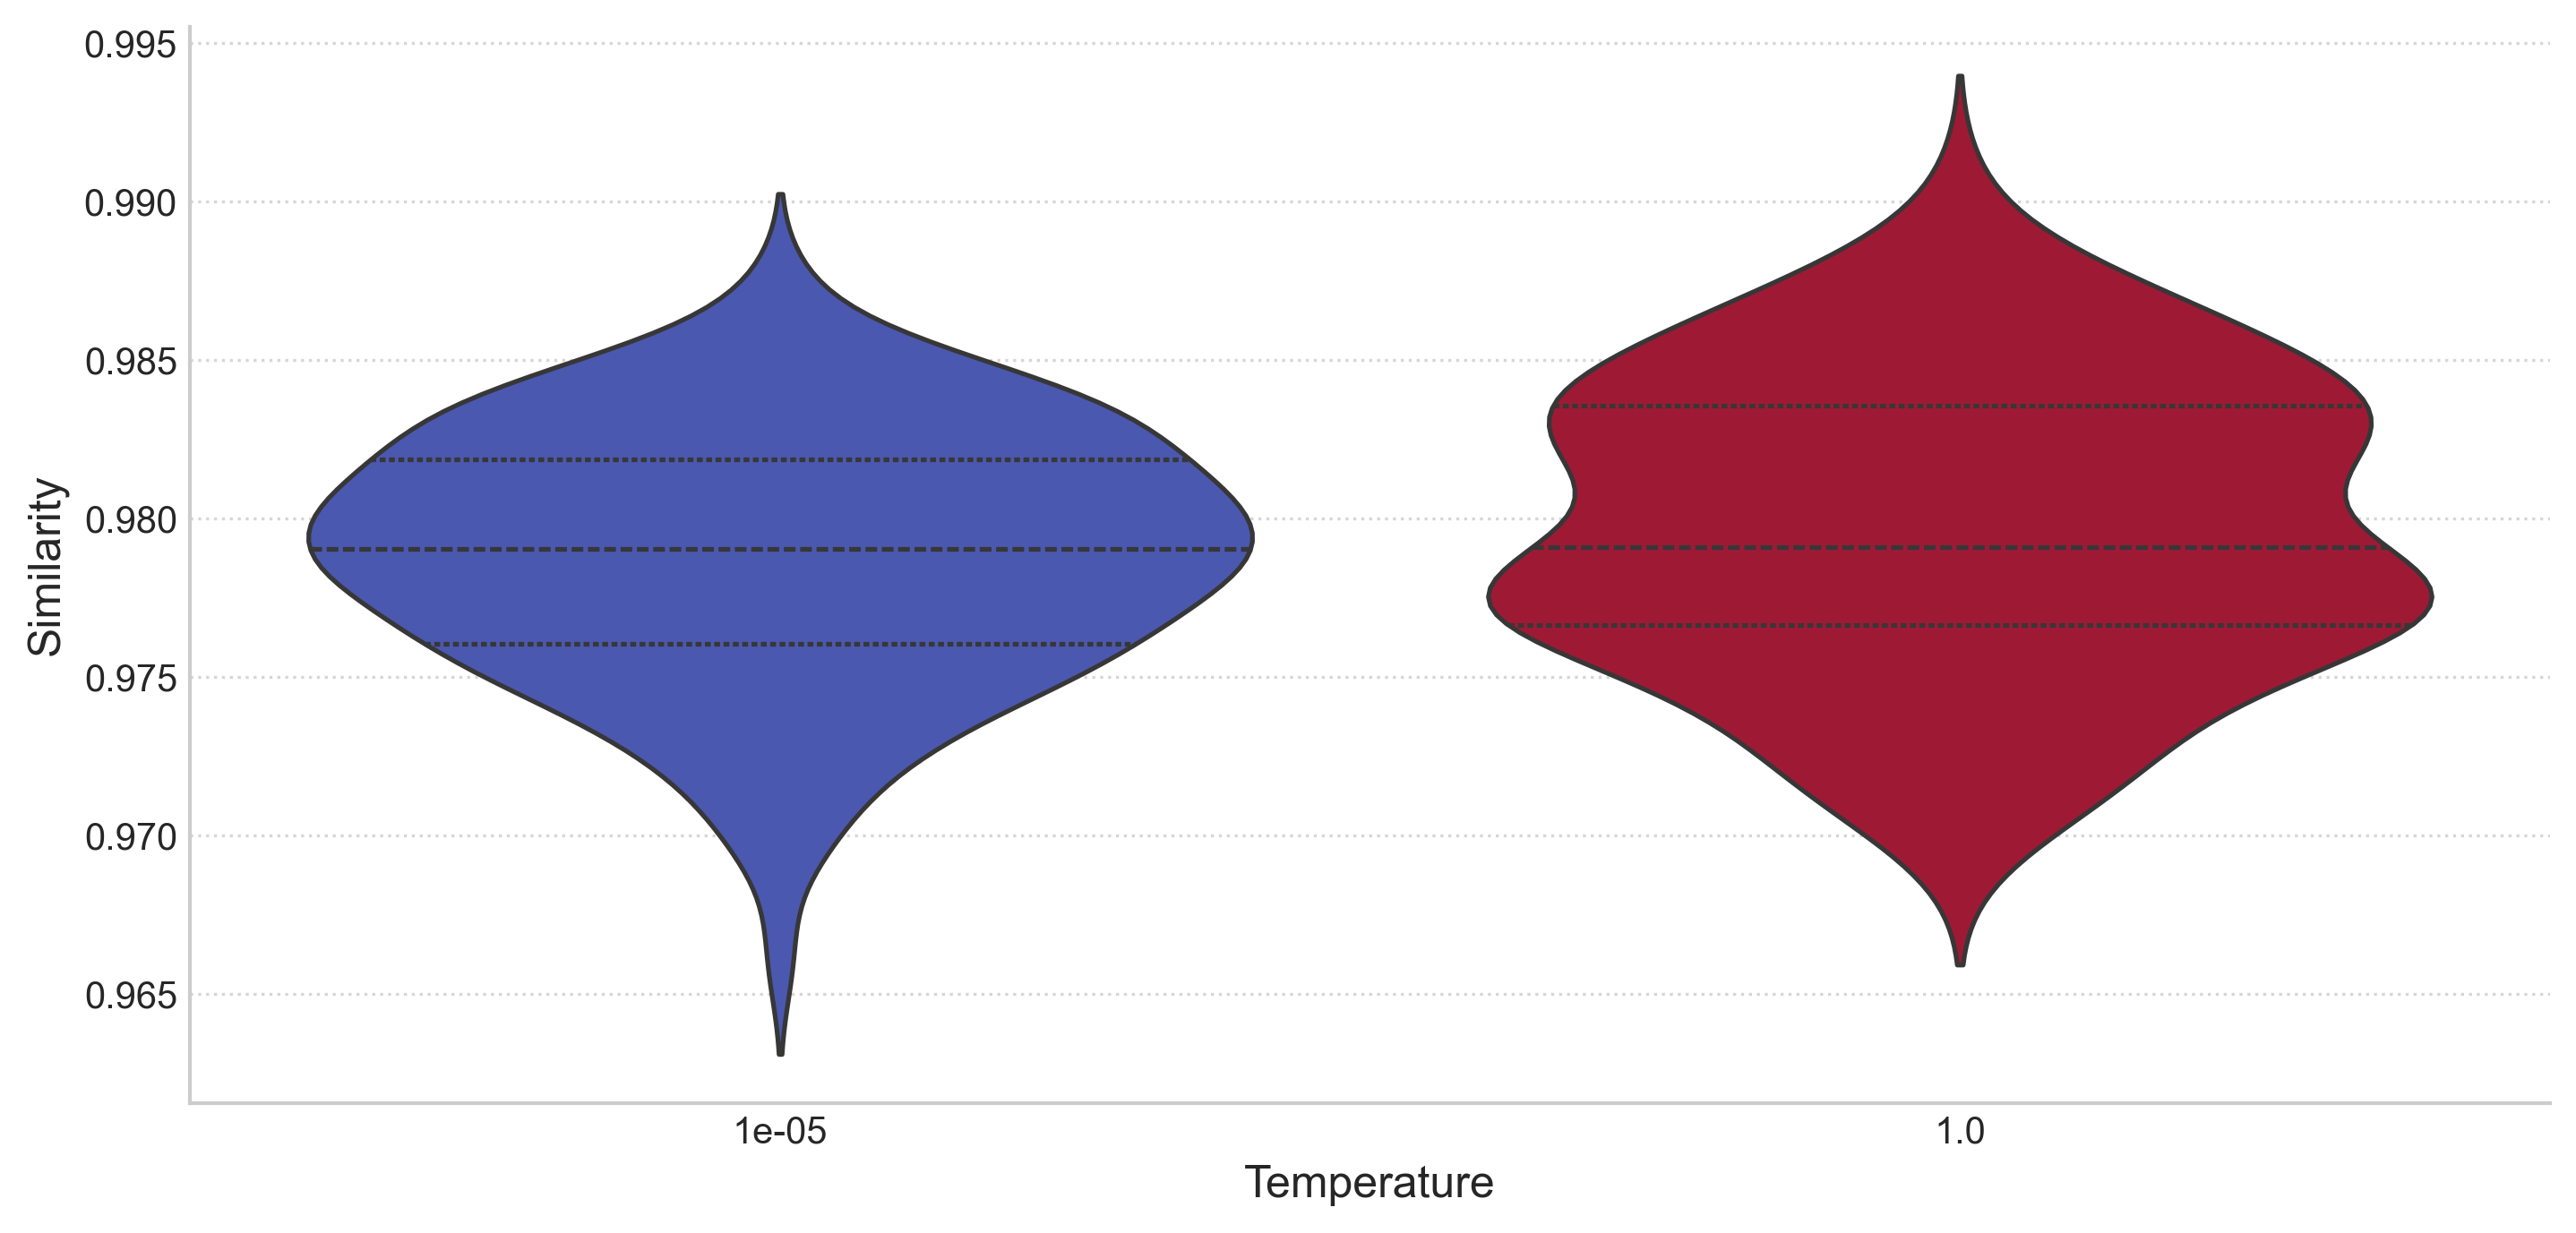
These are only 16 samples for temperatures 0 and 1 (32 total samples) generated via the GitHub Copilot endpoint used in VS Code Copilot Chat extension. I suspect that the temperature value provided in the request body is being ignored during actual generation.
Despite the limited sample size and consideration of only two temperature values, the following plots present anomalies when compared to plots from other experiments (where temperature parameters meaningfully influence token sampling):
-
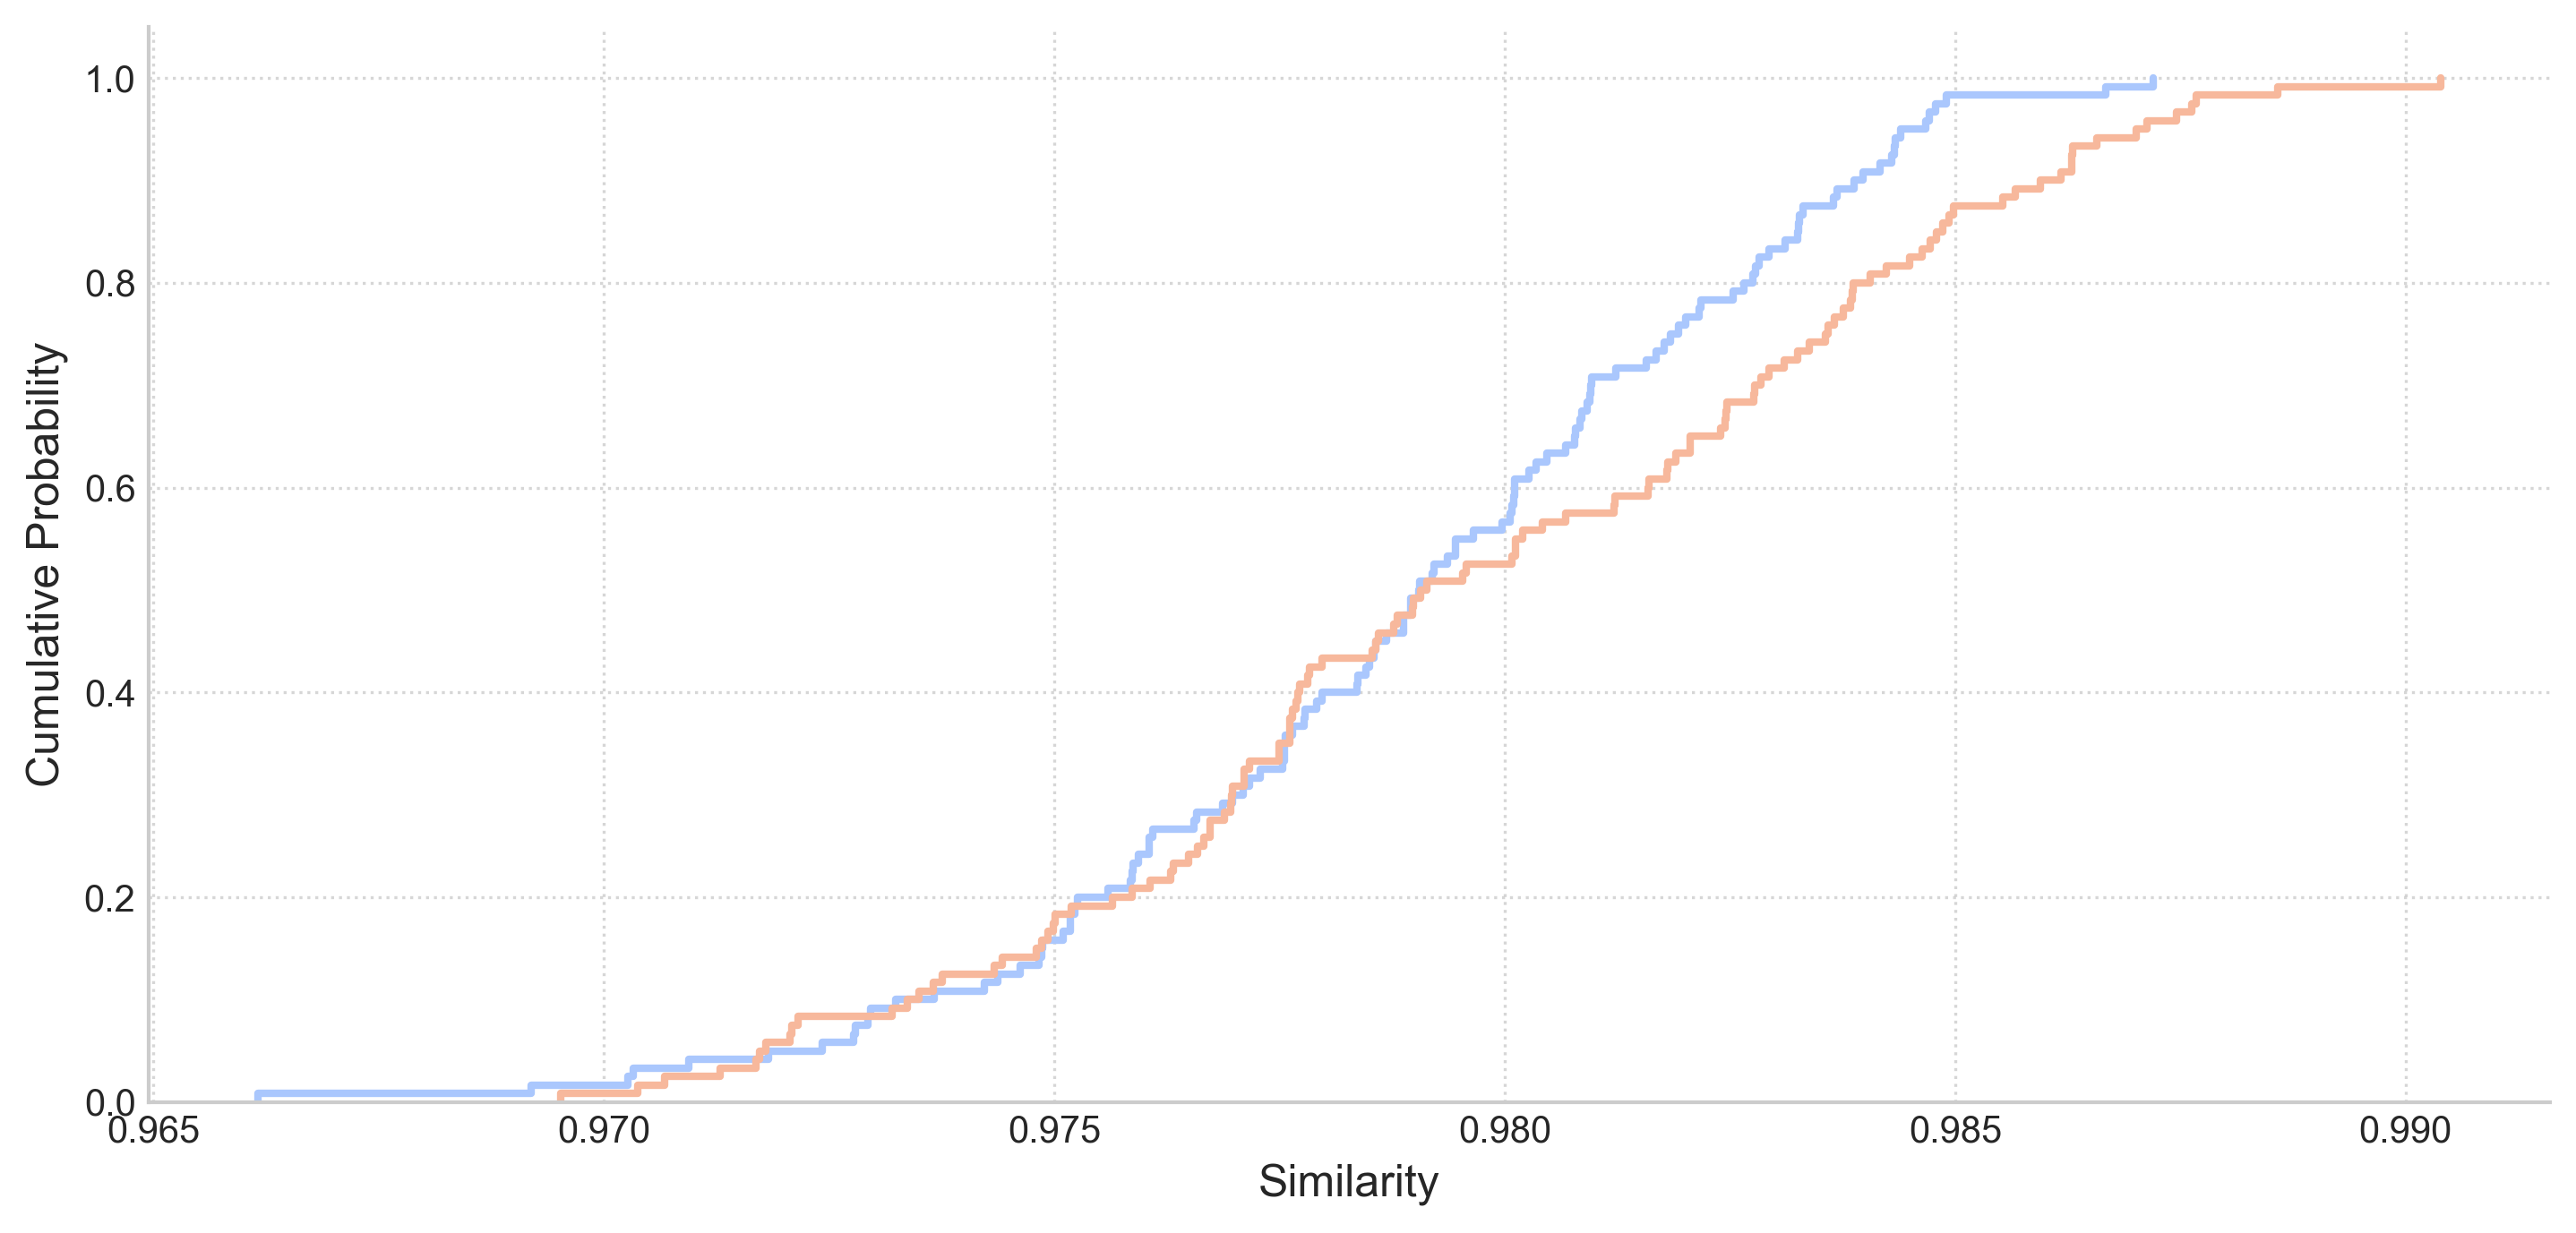
There is nearly no difference in the Cumulative Probability plot curves. Contrary to expectations, the blue curve (temperature = 0) rises faster than the red curve (temperature = 1). This behavior is the exact opposite of plots from other experiments.
-
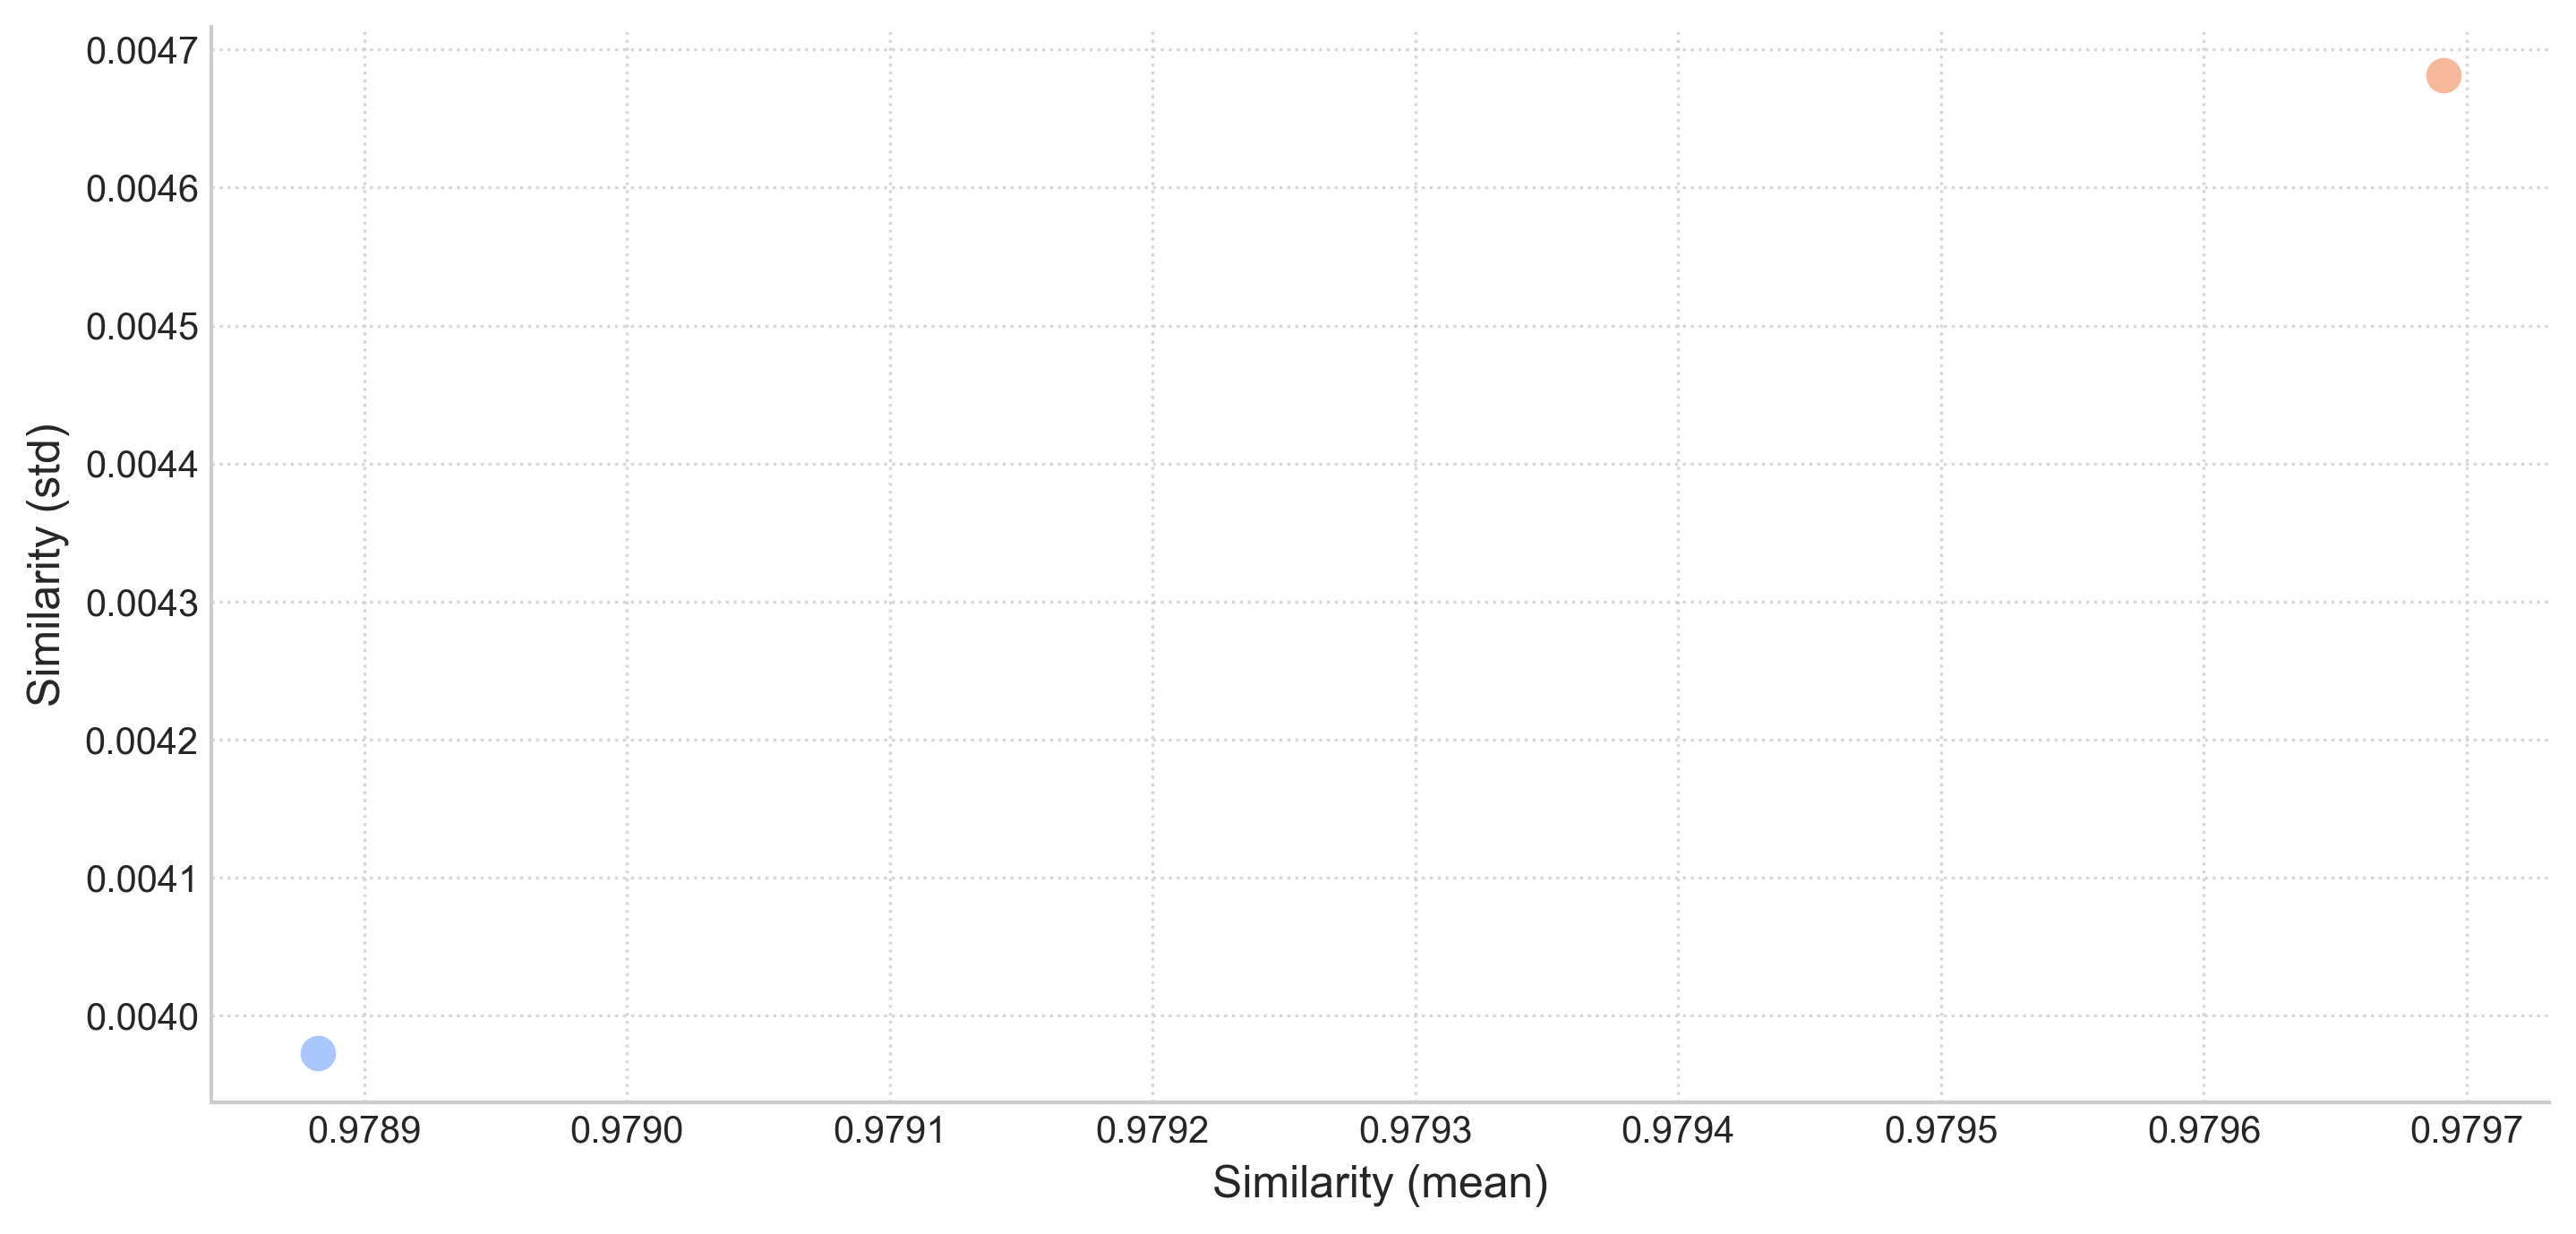
The Similarity (mean) plot shows almost no variation. When the temperature parameter genuinely influences generation, we would expect the red dot (temperature = 1) to be positioned further left (indicating lower mean similarity) and the blue dot (temperature = 0) positioned further right (indicating higher mean similarity).
Conclusion: The temperature parameter appears to be ignored.
What will technology look like in 2050?
- Id:
20250305T170658 - Language Model:
o3-mini - Embedding Model:
jinaai/jina-embeddings-v2-base-en
Statistical Summary
| temperature | Mean | Median | Std Dev | Min | 25% | 75% | Max | Count |
|---|---|---|---|---|---|---|---|---|
| 1e-05 | 0.9789 | 0.9791 | 0.004 | 0.9662 | 0.9761 | 0.9819 | 0.9872 | 120 |
| 1 | 0.9797 | 0.9791 | 0.0047 | 0.9695 | 0.9766 | 0.9836 | 0.9904 | 120 |